
Life's a garden. Dig it.
You can categorize digital images into two major gorups: raster graphics and vector graphics.
Raster graphics
Raster graphics represent an image using a rectangular grid of pixels.
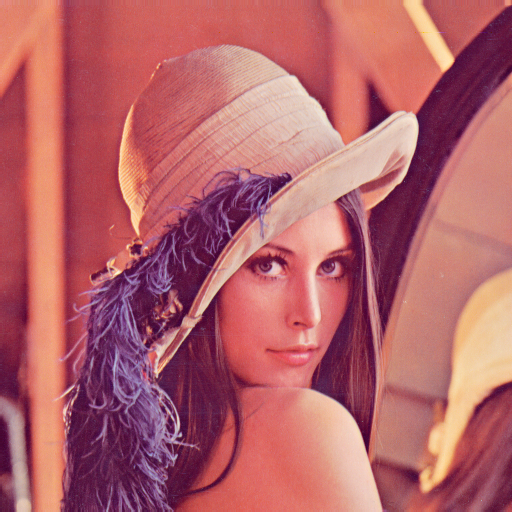
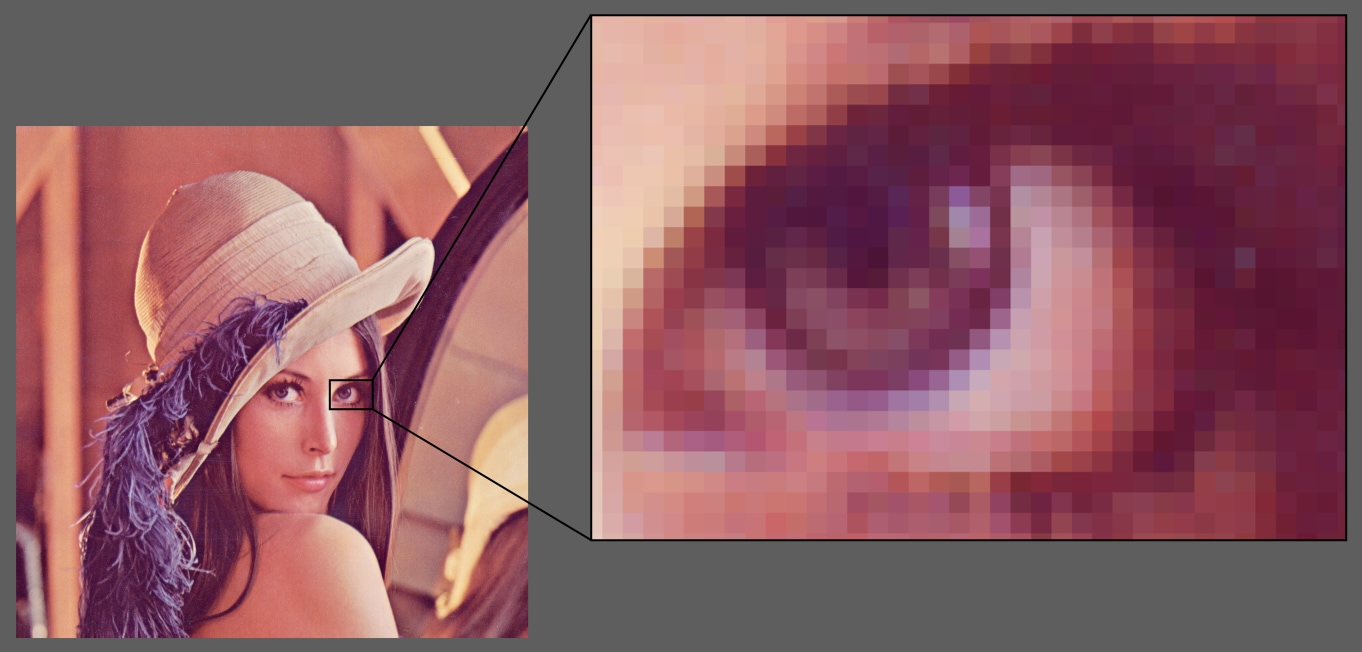
You probably can't see the pixels in this image because they're so small, but if you were to magnify 🔎 the image, the pixels become apparent.
Raster images usually have one of three levels of detail: binary, grayscale, or color.
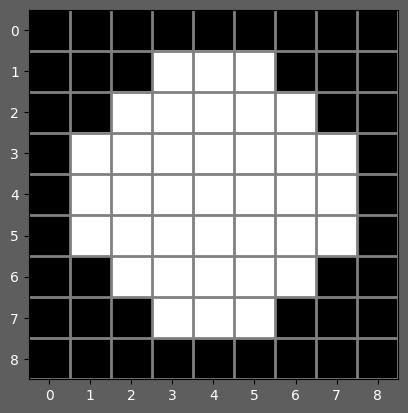
Binary Image
A binary raster image is a rectangular grid of black and white cells. It's usually implemented as an MxN matrix with binary values, typically 0 for black and 1 for white.
[[0, 0, 0, 0, 0, 0, 0, 0, 0],
 [0, 0, 0, 1, 1, 1, 0, 0, 0],
 [0, 0, 1, 1, 1, 1, 1, 0, 0],
 [0, 1, 1, 1, 1, 1, 1, 1, 0],
 [0, 1, 1, 1, 1, 1, 1, 1, 0],
 [0, 1, 1, 1, 1, 1, 1, 1, 0],
 [0, 0, 1, 1, 1, 1, 1, 0, 0],
 [0, 0, 0, 1, 1, 1, 0, 0, 0],
 [0, 0, 0, 0, 0, 0, 0, 0, 0]]
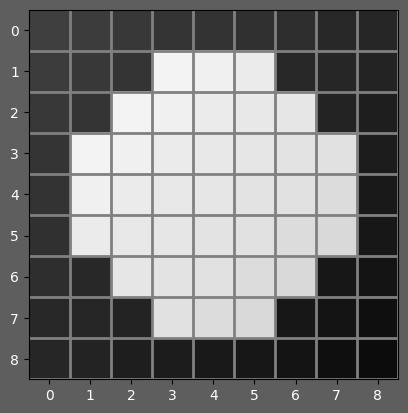
Grayscale Image
A grayscale raster image is a rectangular grid of cells whose values represent the spectrum ranging from black to white. It's usually implemented as an MxN matrix whose values range between 0 (black) and some upper limit (white). The range can be coninuous or discrete. The continuous range from 0 to 1 is a common choice, as is the discrete range from 0 to 255.
[[0.25, 0.24, 0.22, 0.21, 0.2 , 0.19, 0.18, 0.16, 0.15],
 [0.24, 0.22, 0.21, 0.95, 0.94, 0.92, 0.16, 0.15, 0.14],
 [0.22, 0.21, 0.95, 0.94, 0.92, 0.91, 0.9 , 0.14, 0.12],
 [0.21, 0.95, 0.94, 0.92, 0.91, 0.9 , 0.89, 0.88, 0.11],
 [0.2 , 0.94, 0.92, 0.91, 0.9 , 0.89, 0.88, 0.86, 0.1 ],
 [0.19, 0.92, 0.91, 0.9 , 0.89, 0.88, 0.86, 0.85, 0.09],
 [0.18, 0.16, 0.9 , 0.89, 0.88, 0.86, 0.85, 0.09, 0.08],
 [0.16, 0.15, 0.14, 0.88, 0.86, 0.85, 0.09, 0.08, 0.06],
 [0.15, 0.14, 0.12, 0.11, 0.1 , 0.09, 0.08, 0.06, 0.05]]
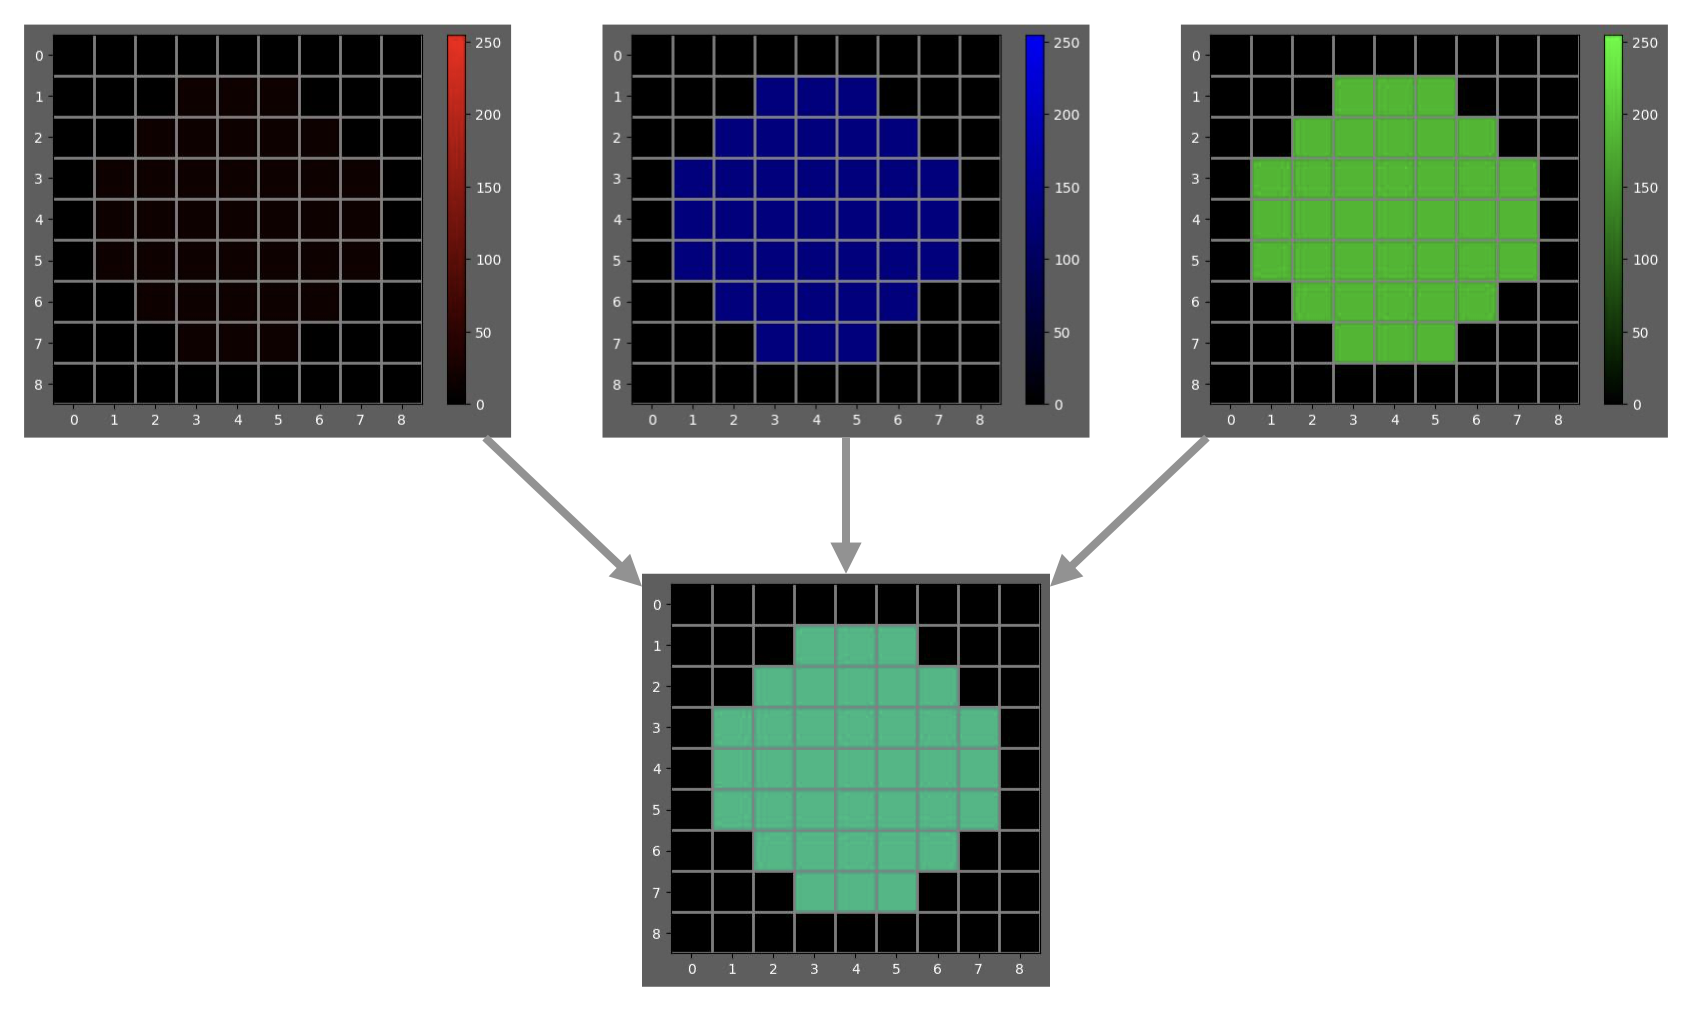
Color Image
A color raster image is a rectangular grid of cells whose values take on any color in the visible color spectrum. It's usually implemented as three MxN matrices where each matrix represents a distinct color channel, typically red, green, and blue. Like grayscal images, the values of each matrix represent the intensity of light for the corresponding color channel. These matrices are commonly combined into a 3xMxN matrix or a MxNx3 matrix.
[[ 0,  0,  0,  0,  0,  0,  0,  0,  0],
 [ 0,  0,  0, 16, 16, 16,  0,  0,  0],
 [ 0,  0, 16, 16, 16, 16, 16,  0,  0],
 [ 0, 16, 16, 16, 16, 16, 16, 16,  0],
 [ 0, 16, 16, 16, 16, 16, 16, 16,  0],
 [ 0, 16, 16, 16, 16, 16, 16, 16,  0],
 [ 0,  0, 16, 16, 16, 16, 16,  0,  0],
 [ 0,  0,  0, 16, 16, 16,  0,  0,  0],
[ 0, 0, 0, 0, 0, 0, 0, 0, 0]][[ 0, 0, 0, 0, 0, 0, 0, 0, 0],
[ 0, 0, 0, 185, 185, 185, 0, 0, 0],
[ 0, 0, 185, 185, 185, 185, 185, 0, 0],
[ 0, 185, 185, 185, 185, 185, 185, 185, 0],
[ 0, 185, 185, 185, 185, 185, 185, 185, 0],
[ 0, 185, 185, 185, 185, 185, 185, 185, 0],
[ 0, 0, 185, 185, 185, 185, 185, 0, 0],
[ 0, 0, 0, 185, 185, 185, 0, 0, 0],
[ 0, 0, 0, 0, 0, 0, 0, 0, 0]][[ 0, 0, 0, 0, 0, 0, 0, 0, 0],
[ 0, 0, 0, 129, 129, 129, 0, 0, 0],
[ 0, 0, 129, 129, 129, 129, 129, 0, 0],
[ 0, 129, 129, 129, 129, 129, 129, 129, 0],
[ 0, 129, 129, 129, 129, 129, 129, 129, 0],
[ 0, 129, 129, 129, 129, 129, 129, 129, 0],
[ 0, 0, 129, 129, 129, 129, 129, 0, 0],
[ 0, 0, 0, 129, 129, 129, 0, 0, 0],
[ 0, 0, 0, 0, 0, 0, 0, 0, 0]]
If you've ever mixed paint, you know that you can mix colors to produce other colors. For example, red + blue = purple.
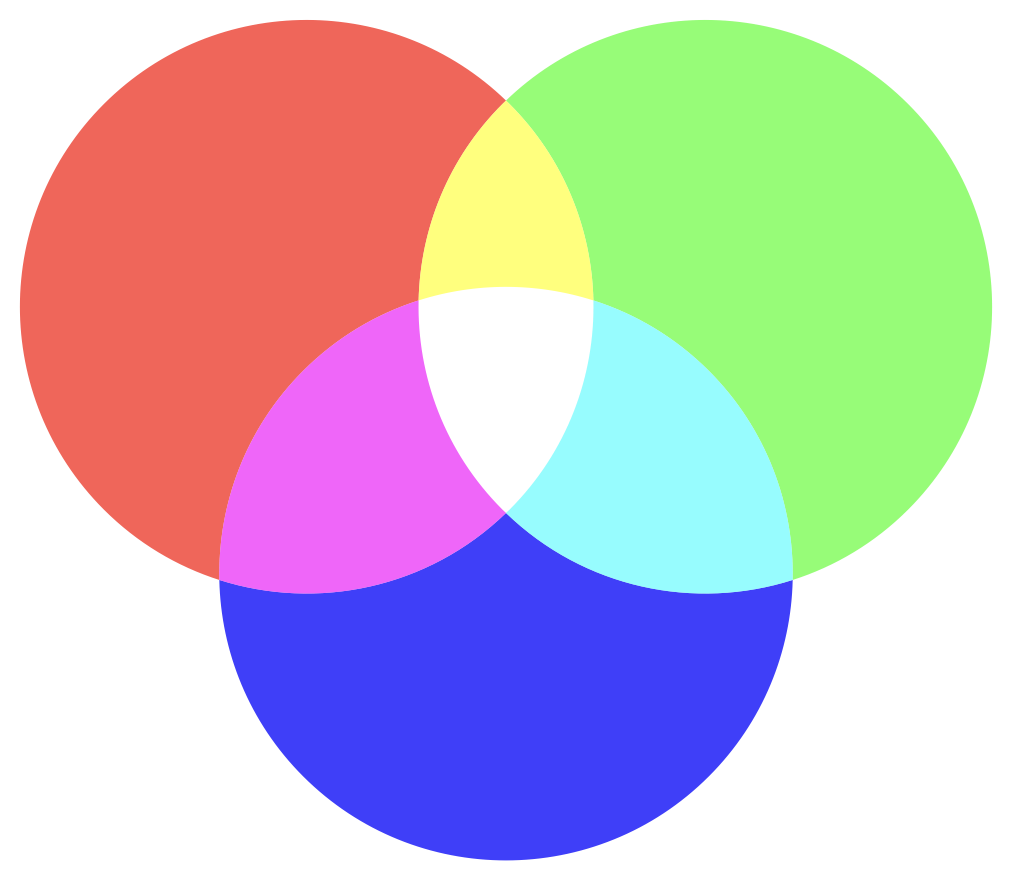
So, how does color mixing work with digital images?
Pixels
A pixel in a raster image is just a single cell in the rectangular grid. For example, this 8x8 image has 64 pixels.
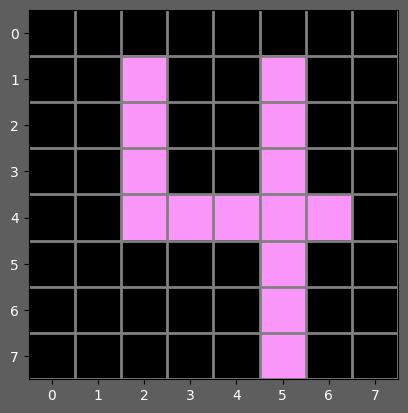
[[[0,0,0], [0,0,0], [  0,  0,  0], [  0,  0,  0], [  0,  0,  0], [  0,  0,  0], [  0,  0,  0], [0,0,0]],
 [[0,0,0], [0,0,0], [250,150,250], [  0,  0,  0], [  0,  0,  0], [250,150,250], [  0,  0,  0], [0,0,0]],
 [[0,0,0], [0,0,0], [250,150,250], [  0,  0,  0], [  0,  0,  0], [250,150,250], [  0,  0,  0], [0,0,0]],
 [[0,0,0], [0,0,0], [250,150,250], [  0,  0,  0], [  0,  0,  0], [250,150,250], [  0,  0,  0], [0,0,0]],
 [[0,0,0], [0,0,0], [250,150,250], [250,150,250], [250,150,250], [250,150,250], [250,150,250], [0,0,0]],
 [[0,0,0], [0,0,0], [  0,  0,  0], [  0,  0,  0], [  0,  0,  0], [250,150,250], [  0,  0,  0], [0,0,0]],
 [[0,0,0], [0,0,0], [  0,  0,  0], [  0,  0,  0], [  0,  0,  0], [250,150,250], [  0,  0,  0], [0,0,0]],
 [[0,0,0], [0,0,0], [  0,  0,  0], [  0,  0,  0], [  0,  0,  0], [250,150,250], [  0,  0,  0], [0,0,0]]]
Each pixel in this image has a red, green, and blue component. Digital screens are designed to transform this information into light.
If you were to look closely at a digital screen, you might see something like this
![]()
Within each pixel are red, green, and blue subpixels that emit light with the intensity specified by the image it's rendering.
Subpixel arrangement
Pixels are usually square, but the arrangement of subpixels varies widely from screen to screen. Here are some examples.
![]()
By Pengo - Own work, CC BY-SA 3.0, https://commons.wikimedia.org/w/index.php?curid=3430548
How do lights from subpixels mix together to create colors other than red, blue, and green?
The light waves emitted by neighboring red, green, and blue subpixels don't actually mix together. They travel in parallel. They're just so small and close together that they hit your retina at about the same location, and your brain interprets them as a color.
For example, when you see the color yellow, it could be a single light wave with a wavelength of 575 nanometers
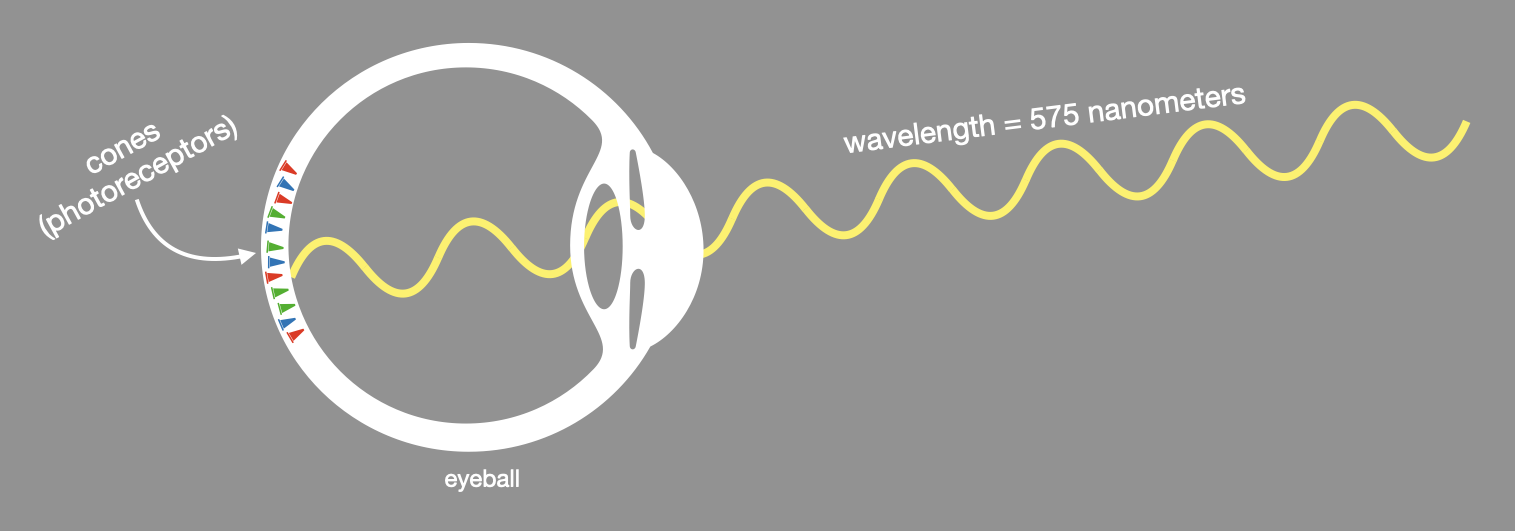
or it could be a combination of light waves with wavelengths of 700 nanometers and 550 nanometers.
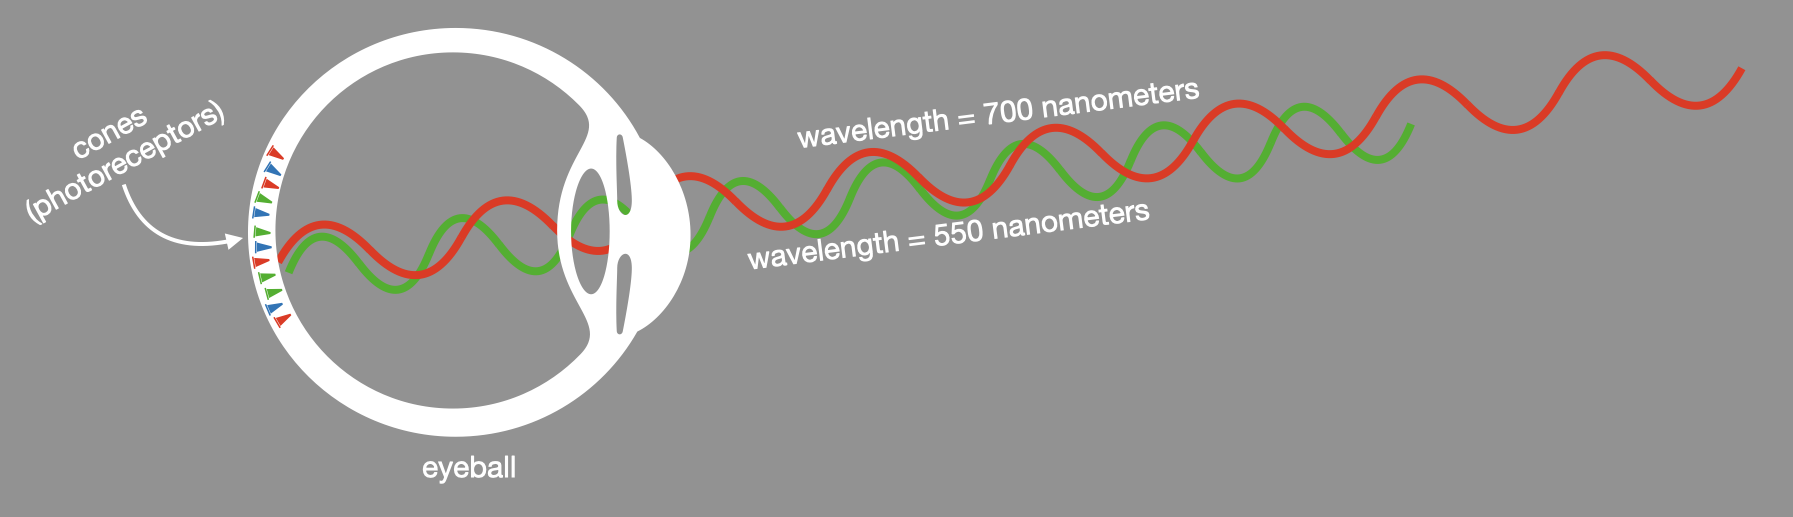
Your brain can't tell the difference because both scenarios stimulate the long, medium, and short cones in your retina in the same way!
So, next time you see a yellow school bus, keep in mind that it might actually be yellow or it could be a bunch of tiny red and green dots.
Resolution
The resolution of an image is a measure of how detailed it is. For raster images, the resolution is usually given by the image dimensions or the total pixel count.
For example, the resolution of this image could be described by any one of the following
- 5,809 x 3,873 pixels or
- 22,498,257 pixels or
- 22.5 megapixels
What's the resolution of the human vision system?
These days, "4K" is a common resolution for images and videos, which translates to 3840 x 2160 pixels ≈ 8M pixels. Compare that to a single human eyeball which has about 120 million rods and 6 million cones, each of which collect data about incoming light.
The bigger difference, however, is the spatial arrangement of data. Raster images collect data in a rectangular grid, so there's a uniform distribution of information throughout the whole image. By contrast, an eyeball has most of its photoreceptors near a central point called the fovea. As you fan out from the fovea, the density of photoreceptors diminishes drastically.

This is why your eyes make saccadic movements across a page as you read - your vision is sharp enough to distinguish letters and words where your eyes focus, but not in your peripheral.
DPI
In software, you'll frequently see the term DPI (Dots Per Inch).
Historically, DPI was used to describe the resolution by which a printer could print images onto paper. Keep in mind that laser and inkjet printers literally insert dots of ink onto paper. So, DPI measures how many dots a printer can squeeze into a linear inch of paper. The higher the DPI, the higher the detail.
For software, DPI really means PPI (Dots Pixels Per Inch). It measures the number of pixels that can fit in a linear inch of canvas. Of course, this metric isn't helpful until you define the canvas on which the image is printed.
Suppose you have a 2,000 x 3,000 pixel image (6 megapixels). If you render the image on a 2 inch by 3 inch canvas, it'll have 1,000 pixels per inch (1,000 PPI). The same image rendered onto a 10 inch by 15 inch canvas would have 200 pixels per inch (200 PPI).
The example above raises an interesting question.. how do digital screens render an image whose resolution is different than resolution of the screen? For example, how might a 20x20 image be rendered on a 30x30 screen?
Vector Graphics
In contrast to raster graphics, vector graphics are created directly from geometric shapes defined on a Cartesian plane, such as points, lines, curves and polygons. SVG files are a common example of vector graphics.
For example, consider how you might represent a red circle.
[[[  0,   0,   0], ..., [255,   0,   0], ..., [  0,   0,   0]]
 [[  0,   0,   0], ..., [255,   0,   0], ..., [  0,   0,   0]]
      ...,         ...,       ...,       ...,        ...,
      ...,         ...,       ...,       ...,        ...,
 [[255,   0,   0], ..., [255,   0,   0], ..., [255,   0,   0]]
      ...,         ...,       ...,       ...,        ...,
      ...,         ...,       ...,       ...,        ...,
 [[  0,   0,   0], ..., [255,   0,   0], ..., [  0,   0,   0]]
[[ 0, 0, 0], ..., [255, 0, 0], ..., [ 0, 0, 0]]]<circle r="45" cx="50" cy="50" fill="red" />Notice how much more compact the vector representation is in this example!
From the viewer's perspective, the main difference between raster and vector graphics is that raster images become pixelated when zoomed in, but vector images can be magnified without losing quality. That's because the pixels necessary to render any portion of a vector image can be continuously recalculated to finer and finer detail.

In practice, vector graphics are typically used for engineering, architecture, surveying, 3D rendering, and typography, whereas raster images are used more for photography and remote sensing.