
Life's a garden. Dig it.
K-Nearest Neighbors is a machine learning model that can be applied to image classification. It has some major drawbacks and performs worse than most Neural Network approaches, so you'll rarely find it being used in practice. However, it's simple to understand. This makes it a good choice for getting started with image classification. (You can also use it as a benchmark model that you hope to improve on with more sophisticated techniques.)
How it works
The basic framework for K-Nearest Neighbors is as follows:
Setup
Select a (positive integer) value for K. Without knowing more, 5 is a decent starting choice.
Training Procedure
Given some training data, simply "memorize it". In practice, this means every training sample is stored inside the model.
Prediction Procedure
Given a new, test sample x ⃗ \vec{x} x,
- Calculate the distance between x ⃗ \vec{x} x and every training sample.
- Identify the K training samples which are closest to x ⃗ \vec{x} x. (These are the K nearest neighbors.)
- Let the K nearest neighbors vote on a class label x ⃗ \vec{x} x using their respective class labels.
- Label x ⃗ \vec{x} x using the majority vote.
Notes
- You may need to devise a tie-breaking mechanism.
- You can implement a weighted K-nearest neighbors model that gives more weight to the votes of training samples that are closest to x ⃗ \vec{x} x.
- K is a hyperparameter that can be optimized (for example, using grid-search with cross validation).
- You need to choose a distance metric that determines the distance between pairs of feature vectors x i ⃗ \vec{x_i} xi and x j ⃗ \vec{x_j} xj.
Distance Metric
The choice of distance metric is a subjective decision, but some common choices include
Toy Example
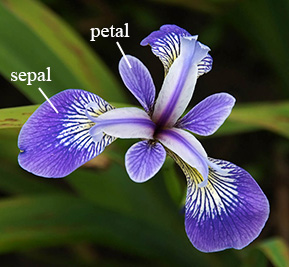
Suppose we want to build a model that classifies Iris flowers into one of three species:
setosaversicolorvirginica
using two numeric features:
sepal lengthpetal length
 https://math.umd.edu/~petersd/666/html/iris_pca.html
Our training data looks like this
    dataset sepal length petal length    species
 1:   train          5.1          1.9     setosa
 2:   train          6.5          5.5  virginica
 3:   train          4.9          1.4     setosa
...     ...          ...          ...        ...
28:   train          7.0          4.7 versicolor
29:   train          5.2          1.4     setosa
30:   train          6.6          4.4 versicolor
Since each training sample has two features, we can plot the training data on a Cartesian plane.
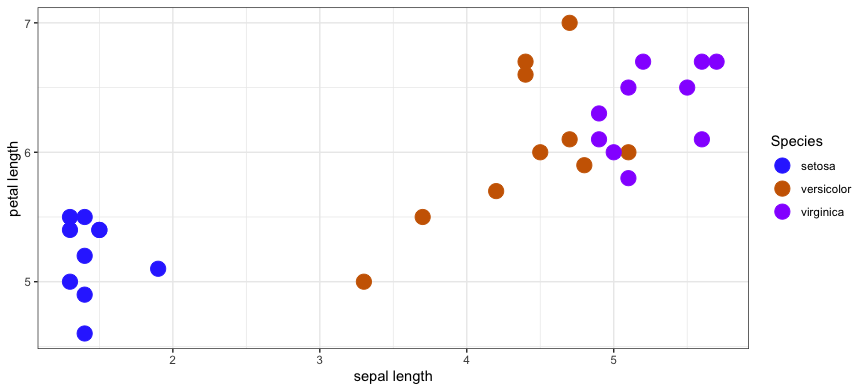
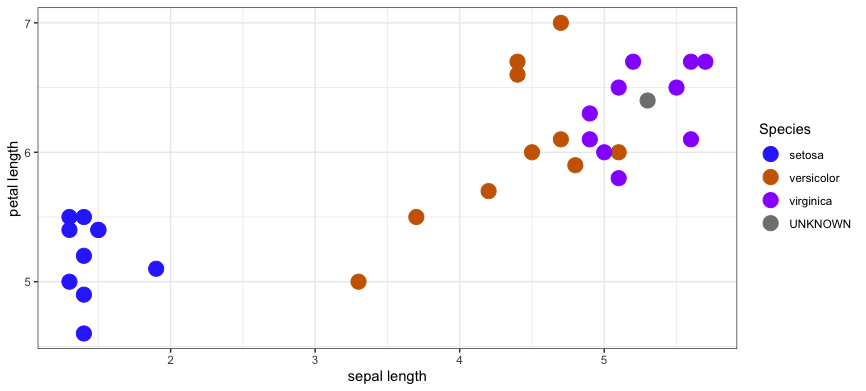
Now suppose someone asks you to help them identify the species of an Iris flower you. You haven't seen this flower before. They give you their measurement for the sepal length (x) and petal length (y). You can add this unlabelled point to the graph.
Using a K-Nearest Neighbors model with K = 5 and the distance metric is L1, you'd select these 5 training samples as the nearest neighbors.
   dataset sepal length petal length    species  distance
1:   train          6.5          5.1  virginica 0.2236068
2:   train          6.5          5.5  virginica 0.2236068
3:   train          6.7          5.2  virginica 0.3162278
4:   train          6.3          4.9  virginica 0.4123106
5:   train          6.7          5.6  virginica 0.4242641
6:   train          6.1          5.6  virginica 0.4242641
7:   train          6.0          5.1 versicolor 0.4472136
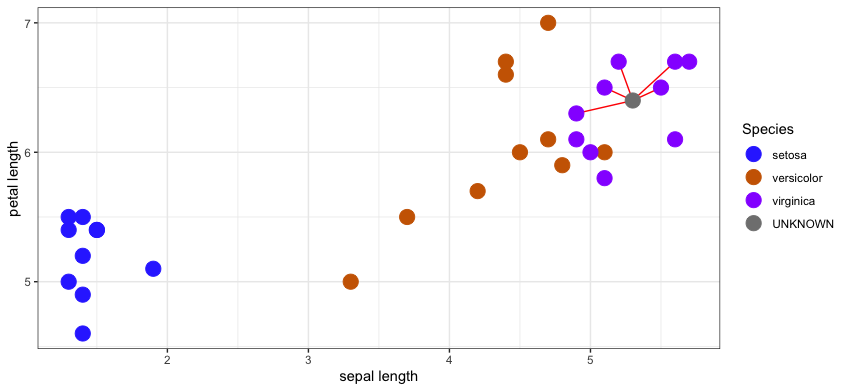
Their majority vote in this example would clearly be virginica.
Do I need to standardize the features?
Yes!
We didn't in this toy example for the sake of simplicity, but in practice you should standardize the features so that they're all on a "level playing field".
Imagine classifying cars by their weight in pounds and length in feet. Without standardizing the features, the distance between two samples would be completely dominated weight, preventing car length from adding predictive power to the model.
Does class imbalance affect the predictions?
Yes! But it's complicated...
KNN for image classification
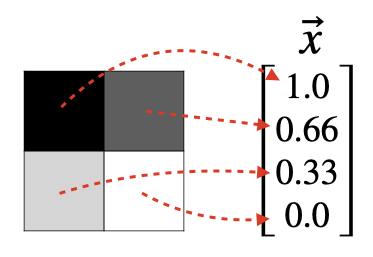
When working with image data, it's customary to map each pixel value to a component of x ⃗ \vec{x} x.
For example, a 2x2 grayscale image generates a feature vector in R 4 \mathbb{R}^4 R4.
A a 2x2 RGB image generates a feature vector in R 12 \mathbb{R}^{12} R12.
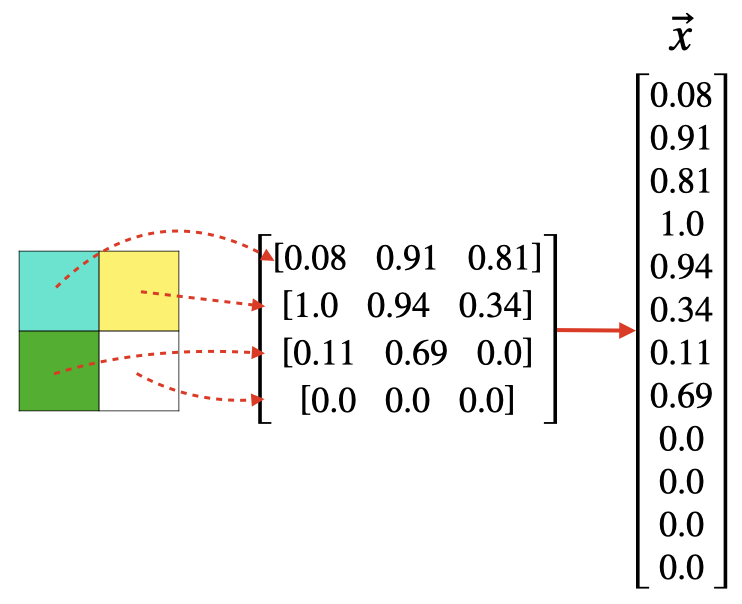
Although the feature space is quite large, the framework for implementing KNN is no different.
Drawbacks
K-Nearest Neighbors has some major drawbacks for image classification..
Runtime
KNN is fast to train but slow to predict. For M training samples and N test samples, KNN must calculate an MxN matrix of distances before finding the K smallest values per test sample. The scales poorly as M and N increase.
Not robust
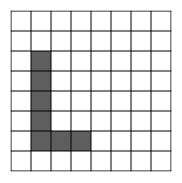
Most distance metrics applied to images measure how much the images overlap, and small peturbations in an image can result in a seemingly large distance from the original.
For example, suppose this image of the letter "L" exists in the training data
and this image of an "L" exists in the test data
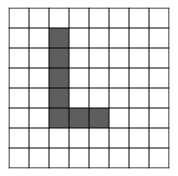
The second L is just the first L translated slightly. Although these images appear quite similar, the L 2 L^2 L2 distance metric will report a large distance between them.