Life's a garden. Dig it.
Challenge
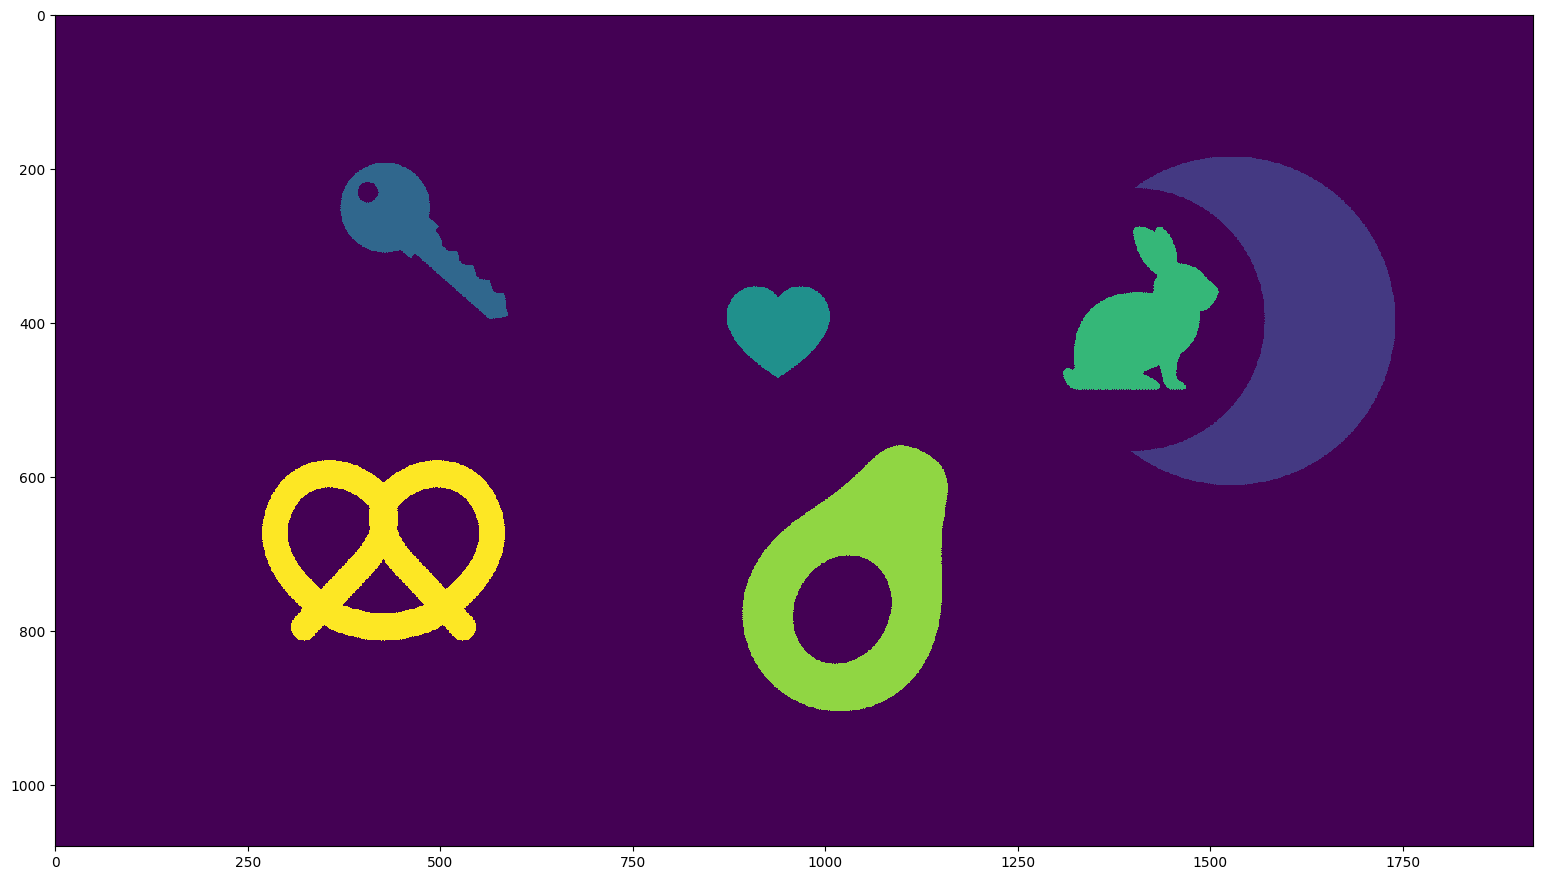
Observe the following binary image.

Design and implement an algorithm that segments each object. The output should be a 2-D array, the same shape as the input, where each element is labelled
- 0 if the pixel represents background,
- 1 if the pixel is part of the first object
- 2 if the pixel is part of the second object
- ...
- K if the pixel is part of the Kth object
For example, if this were the input...
[[0, 1, 0, 0, 1],
 [1, 1, 0, 0, 0],
 [0, 0, 0, 1, 1],
 [0, 0, 0, 1, 1]]
then this should be the output 👇
[[0, 1, 0, 0, 2],
 [1, 1, 0, 0, 0],
 [0, 0, 0, 3, 3],
 [0, 0, 0, 3, 3]]
Starter Code
import numpy as np
from PIL import Image

img = Image.open('CV-binary-segmentation.png')

# Inspect
print(img.format, img.size, img.mode)  # PNG (1920, 1080) 1

# Convert to array
arr = np.array(img)
Pixel Connectivity
Have a look at these 9 pixels.
![]()
Is pixel E connected to pixel A? In other words, would you consider A a neighbor of E?
This is something you get to decide. Typically, people use 4-connectivity or 8-connectivity .
![]()
Hint 1
Hint 2
Solution
This problem is known as Connected Component Labelling. Wikipedia describes two algorithmic solutions:
Two-pass Algorithm
In this algorithm, you iterate over each cell in the array, in row-major order two times.
During the first pass, while observing the current cell...
-
If the cell is background, give it label 0
-
If the cell is foreground, look at this cell's neighbors which have already been passed. (In my solution below, I use 8-connectivity, so I observe neighbors to the northwest, north, northeast, and west.)
-
If all of those neighbors are background (0), give this cell a new, unique label.
-
Otherwise, identify and use the minimum label amongst those neighbors.
If at least two neighbors use a different, non-zero label, take note of their equivalence, since they belong to the same connected component.
-
During the second pass, while observing the current cell...
- If the cell is not background, look up its equivalent labels and assign it the minimum equivalent label.
After the second pass, every component should be segmented with a distinct label. However, the labels won't necessarily be the unique integers 0, 1, 2, ... So, we perform a final step, mapping the unique labels onto the set {0, 1, ... K}.
import numpy as np
from PIL import Image
from scipy.cluster.hierarchy import DisjointSet

img = Image.open('CV-binary-segmentation.png')
arr = np.array(img)

## Two pass
labelled = np.full(arr.shape, 0)
components = 0

# Create a dictionary of label -> set of equivalent labels
equivalences = DisjointSet([])

# Helper function
def access_with_fallback(array, i, j, fallback = 0):
    """
    Helper function to access element (i,j) of 2-D array
    If (i,j) is out of bounds, return fallback instead of raising
    and exception

    Args:
        array: 2-D array
        i: row index
        j: column index
        fallback: Value to return if (i,j) raises an 'out of bounds' exception.
                  Defaults to 0.

    Returns:
        Returns the array value at (i,j) unless it's out of bounds, in which case
        fallback is returned
    """

    # If the index is out of bounds, return the fallback
    if i < 0 or i >= array.shape[0] or j < 0 or j >= array.shape[1]:
        return fallback

    # Return the element at the requested index
    return  array[i, j]


# First pass
for i in range(arr.shape[0]):
    for j in range(arr.shape[1]):

        # If this pixel is background, go to the next pixel
        if arr[i, j] == False:
            continue

        # Get the label from this pixel's northwest, north, northeast, and west neighbors
        northwest = access_with_fallback(labelled, i - 1, j - 1)
        north = access_with_fallback(labelled, i - 1, j)
        northeast = access_with_fallback(labelled, i - 1, j + 1)
        west = access_with_fallback(labelled, i, j - 1)

        # Build set with unique neighbor labels
        priorNeigborLabels = set([northwest, north, northeast, west]) - { 0 }

        # If no prior neighbors have a label, use a new label
        # Then go to the next pixel
        if len(priorNeigborLabels) == 0:
            labelled[i, j] = components + 1
            components += 1
            continue

        # At least one prior neighbor has a label
        # Identify the min label and use it
        labelled[i, j] = min(priorNeigborLabels)


        # If only one unique neighbor label is present, go to the next pixel
        if len(priorNeigborLabels) == 1:
            continue

        # Define an equivalence relation between every pair of neighbor labels
        for x in priorNeigborLabels:
            equivalences.add(x)
            others = priorNeigborLabels - { x }

            for y in others:
                equivalences.add(y)
                equivalences.merge(x, y)


# Second pass
for i in range(arr.shape[0]):
    for j in range(arr.shape[1]):

        # If this pixel is background, go to the next pixel
        if arr[i, j] == False:
            continue

        # Set this pixel's value to it's min equivalent
        # If there isn't one, go to the next pixel
        try:
            label = labelled[i, j]
            labelled[i, j] = equivalences[label]
        except KeyError:
            continue


# Extract the sorted unique values, and the indices of the unique
# array which can be used to reconstruct the original array
uniques, result = np.unique(labelled, return_inverse=True)
Checking the result
We can look at each labelled component, individually, like this
for i in range(len(uniques)):
    Image.fromarray(np.where(result == i, True, False))
 Plot of the first object (i.e. the pixels with label 1)
Or we can plot all components on the same chart using Matplotlib, like this
import matplotlib.pyplot as plt

plt.imshow(result, interpolation='none', aspect='equal')