
Life's a garden. Dig it.
Challenge
Create an image of a circle like this one, from scratch, using NumPy. Then plot it with Matplotlib.
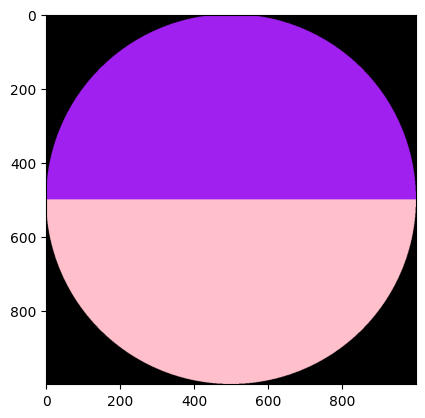
The image should be a raster image, 1000 pixels wide by 1000 pixels tall. The circle is purple above and pink below.
Solution
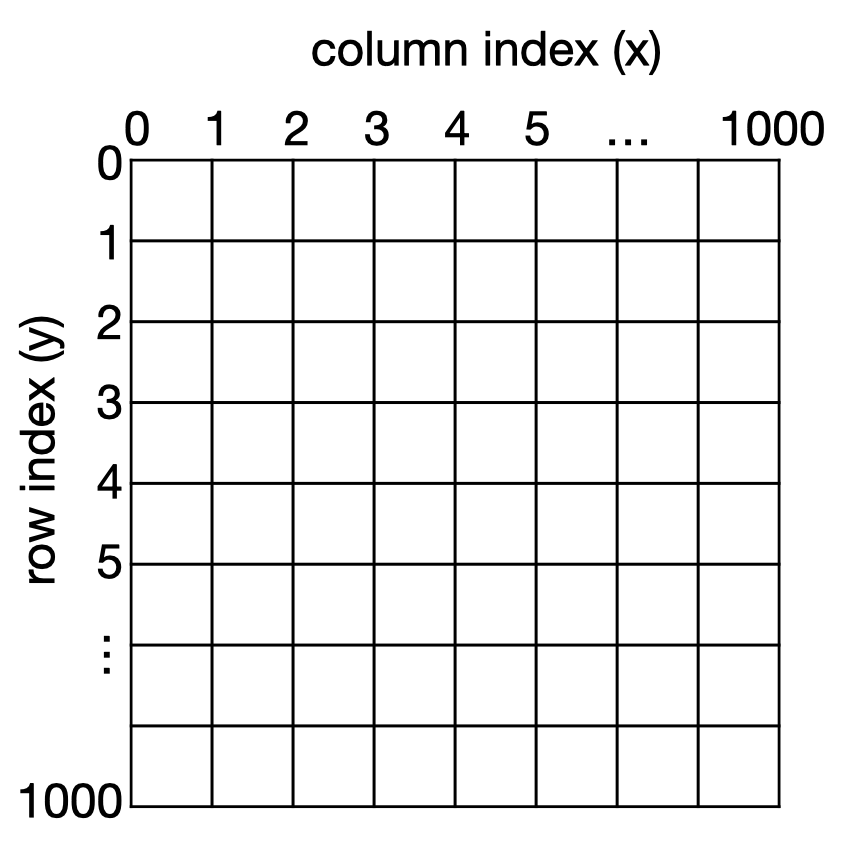
Imagine the raster grid lying in a Cartesian-like coordinate system.
Now recall the general equation for a circle...
( x − h ) 2 + ( y − k ) 2 = r 2 (x - h)^2 + (y - k)^2 = r^2 (x−h)2+(y−k)2=r2where ( h , k ) (h, k) (h,k) represents the circle's center and r r r represents its radius.
In this case, we want the radius to be 500 and we want the center at (499.5, 499.5). And since we want to activate points inside the circle, we want to use the inequality
( x − h ) 2 + ( y − k ) 2 < r 2 (x - h)^2 + (y - k)^2 < r^2 (x−h)2+(y−k)2<r2Once we identify and activate pixels in the circle interior, we can easily make the upper half purple and the lower half pink.
import numpy as np
from matplotlib import pyplot as plt

# Define colors
PINK = np.array([255, 192, 203])
PURPLE = np.array([160, 32, 240])

# Initialize a 2-D circle with boolean values
x = np.arange(1000)
y = np.arange(1000).reshape(-1, 1)
circle2D = (x + 0.5 - 500)**2 + (y + 0.5 - 500)**2 < 500**2

# Add the color channel and convert dtype to int
circle3D = np.repeat(circle2D[:, :, np.newaxis], 3, axis=2).astype('int64')

# Impute the array with colors
circle3D[np.arange(1000) > 500, :] *= PINK
circle3D[np.arange(1000) <= 500, :] *= PURPLE

# Plot the binary image
plt.imshow(X=circle3D)