Life's a garden. Dig it.
Challenge
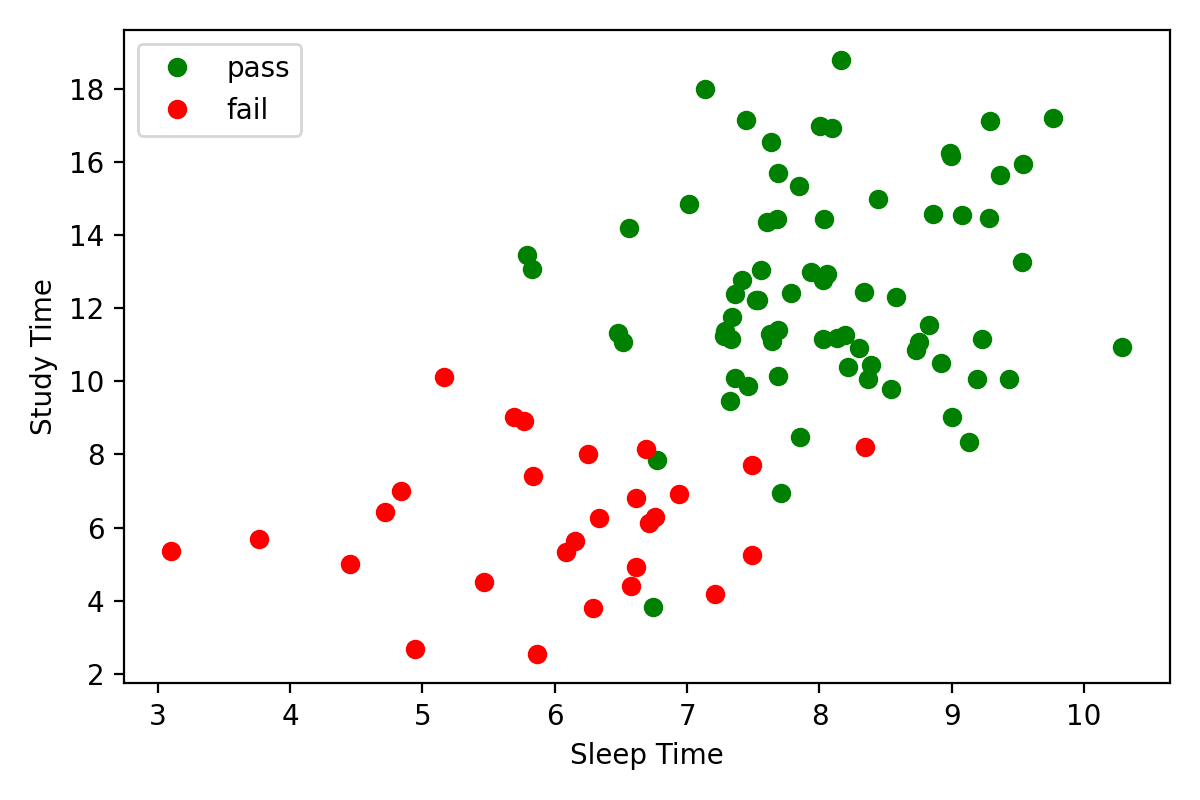
A class of 100 students takes an exam. At the end of the exam, the students self-report the number of hours they studied 📚 for the exam and the amount of sleep 😴 they got the night before. Here's what the data looks like including the Pass/Fail exam results.
import numpy as np

# random number generator
rng = np.random.default_rng(123)

# data (72 passes / 28 fails)
passes_sleep = rng.normal(loc=8, scale=1, size=72)
passes_study = rng.normal(loc=12, scale=3, size=72)
fails_sleep = rng.normal(loc=6, scale=1.5, size=28)
fails_study = rng.normal(loc=6, scale=2, size=28)
Pass vs Fail Plot
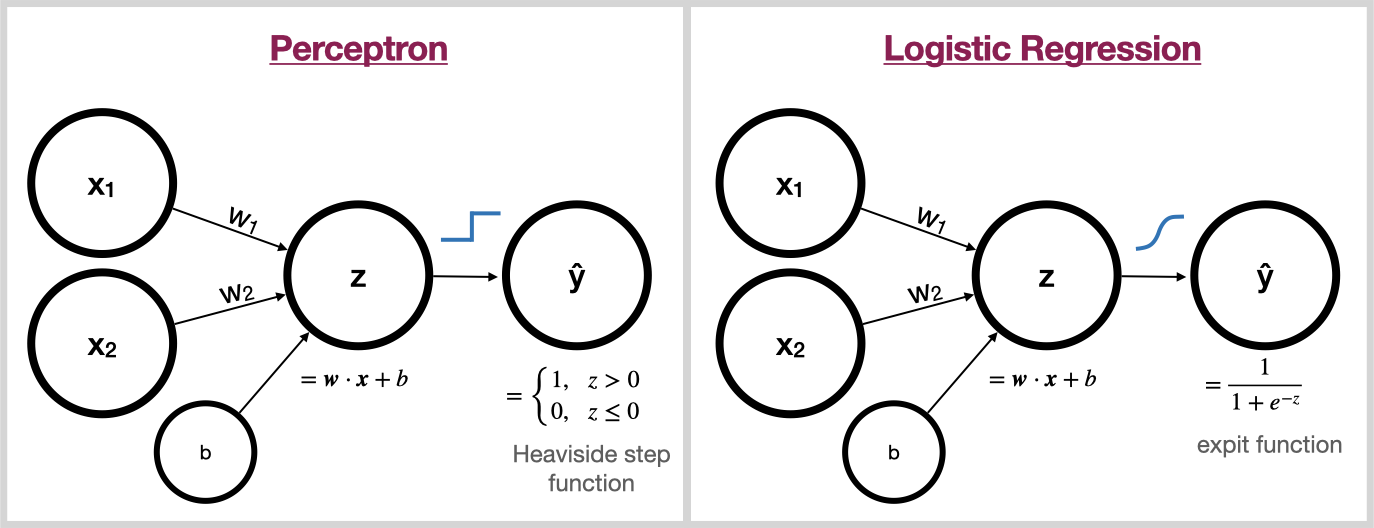
Design and fit a logistic regression model to this data. Be sure to subclass nn.Module.
Here's some starter code.
import torch
from torch import nn

# set random seed for reproducibility
torch.manual_seed(0)

class LogisticRegression(nn.Module):
    """
    Logistic Regression model of the form 1/(1 + e^-(w1x1 + w2x2 + ...wnxn + b))
    """

    pass
Perceptron vs Logistic Regression
Bonus 1
Use your fitted model to make predictions on the following test data.
test_sleep = np.array([
    7.06, 7.19, 7.59, 8.84, 9.66, 9.72, 8.81,
    8.44, 5.66, 9.13, 8.04, 5.31, 7.07, 8.33, 7.83
])
test_study = np.array([
    19.89, 13.36, 12.7, 14.1, 14.19, 12.4, 10.88,
    13.09, 7.88, 6.35, 4.89, 6.65, 3.67, 5.79, 8.09
])Solution (Logistic Regression)
This content is gated
Subscribe to the product below to gain access