keywords: bicycle performance, kinetic energy, GPS analysis, hill climbing, speed comparison
I asked God for a bike, but I know God doesn’t work that way. So I stole a bike and asked for forgiveness.
– Emo Philips
Why do brake pads wear out so much faster on an electric bike than a regular bicycle? This seemingly simple question leads us down a fascinating path of physics, data analysis, and real-world experimentation. Through the lens of two very different bikes - a chainless mechanical bicycle and an electric bike capable of reaching 28 mph - we'll explore how speed and mass affect the energy demands of cycling.
Using data from identical 20-mile rides, we'll discover that it's not just about going faster - it's about the complex interplay between kinetic energy, potential energy, and how these forces shape our cycling experience. Whether you're climbing the steepest hills in town or cruising down a creek-side trail, understanding these principles can help explain why some rides feel effortless while others leave you (and your brake pads) thoroughly worn out.
A Tale of Two Bicycles
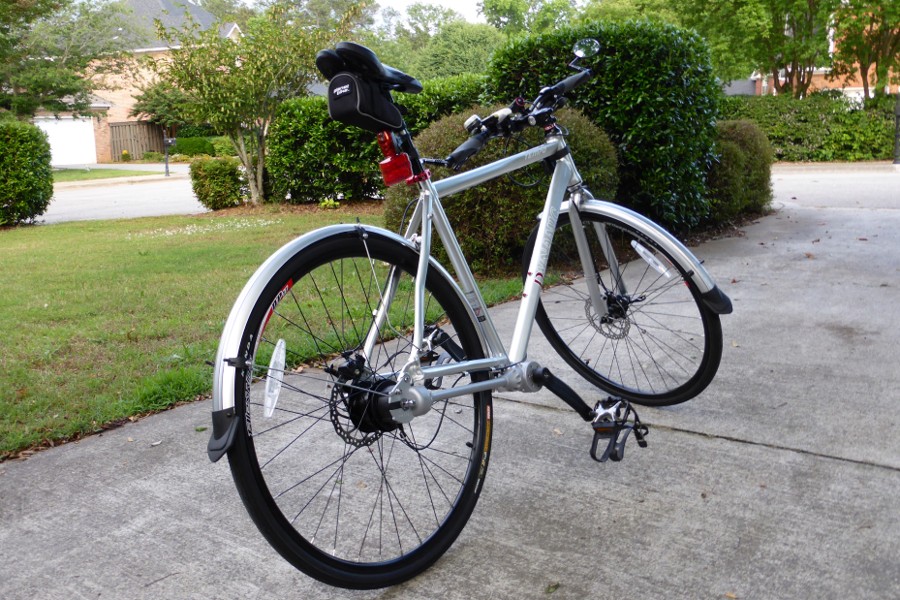
I have two bicycles, a ten-year-old Dynamic Tempo 8 (my Motorless Child)
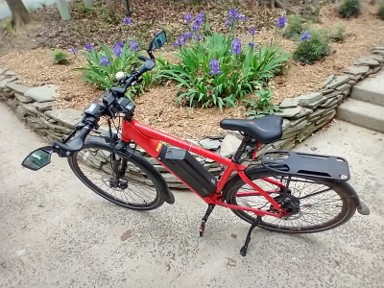
and a four-year-old Juiced CrossCurrentX.
You might notice there's no chain on the Tempo 8. Instead, it has a drive shaft between the cranks and the rear hub, so all of the transmission is enclosed and free of dirt and grease. A Shimano Alfine 8 internal gear hub is built into the rear wheel, similar to the hubs on old three-speed Raleigh bicycles, but with eight gears.
You can shift the Alfine 8 any time, even when stopped, and the gears are completely enclosed so they never get dirty. The eight speeds are nicer than having only three, but the range is limited, so it's a lot of work going up steep hills.
The CrossCurrentX uses a chain and has a nine-speed Altus cassette and a 750 W Bafang rear hub motor controlled by a torque and cadence sensor at the pedals. You can choose motor assist anywhere between "0" - Throttle Operation Only to "R" - Race Track Mode (Refer to local laws and regulations before using).
Set to "R" the top speed is 28 mph according to the manual, but if you want to play in traffic you can probably get it to 35-40 mph. The range is at least 80 miles with the 52 V / 19.2 Ah extended range battery.
Both bikes have disk brakes. The Tempo 8 uses mechanical calipers and the CrossCurrentX has Tektro hydraulic brakes. I've never replaced the pads on the Dynamic bike, but it seems I have to replace them about once a year on the electric bike.
Brake Failure
Why do the brake pads need to be replaced so often on the Juiced bike? My first thought was that the extra speed and mass must be the reason. The CrossCurrentX is about 30 kg while the Tempo 8 is only half that, and the rider adds at least another 80 kg, but the speed makes the difference.
The equation for kinetic energy is
K E = 1 2 m v 2 ( k g − m 2 s 2 = J ) KE = \frac{1}{2}mv^2 \; \left( \frac{kg-m^2}{s^2} = J \right) KE=21mv2(s2kg−m2=J)where m m m is the mass ( k g kg kg) and v v v is the velocity ( m / s m/s m/s). Kinetic energy is the energy arising from the motion of the bicycle, and to stop you need to dissipate it somehow. If I go twice as fast on the electric bike, then the velocity component quadruples.
Suppose I'm riding the Motorless Child at 10 mph = 4.5 m/s, and the combined mass is 95 kg. Then the kinetic energy is
K . E . = 0.5 × 95 × 4. 5 2 = 960 J . K.E. = 0.5 \times 95 \times 4.5^2 = 960 \; J. K.E.=0.5×95×4.52=960J.On the Juiced bike, the combined mass is 110 kg and the speed might be 9 m/s, so
K . E . = 0.5 × 110 × 9 2 = 4455 J K.E. = 0.5 \times 110 \times 9^2 = 4455 \; J K.E.=0.5×110×92=4455Jor 4.6 times as high.
The kinetic energy might be the answer, but let's do a science.
A Tale of Two Rides
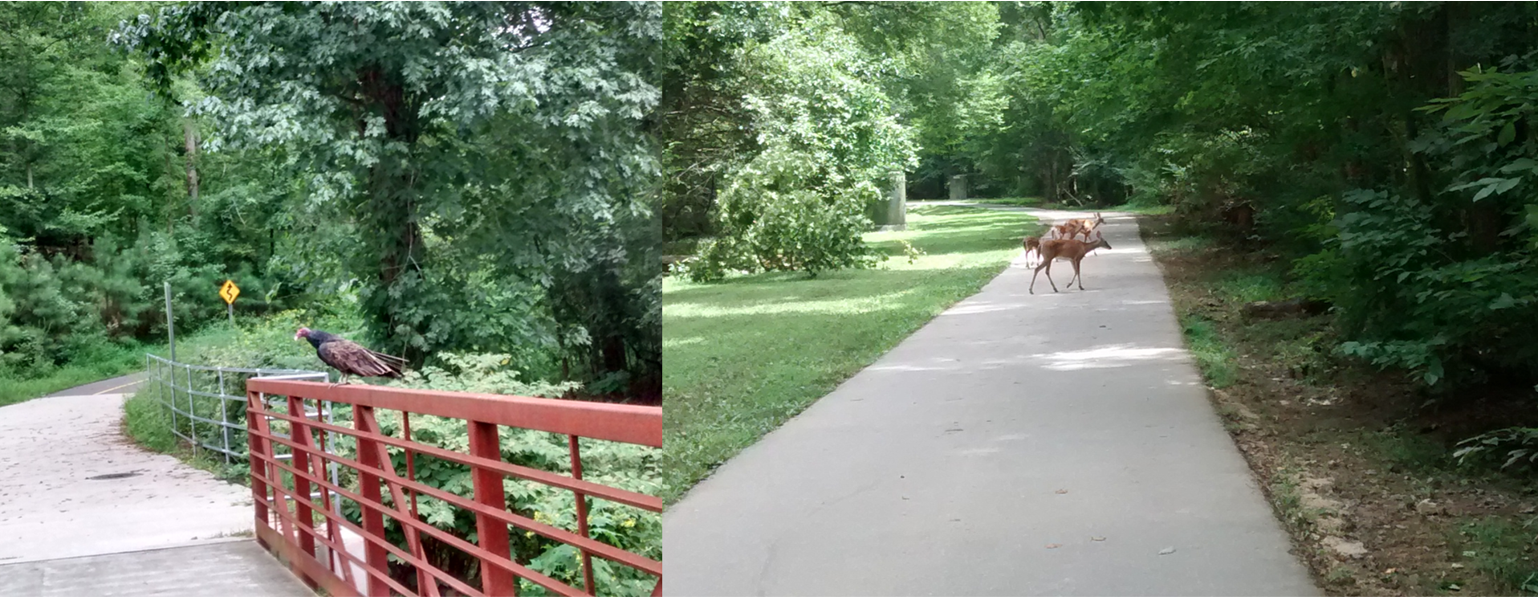
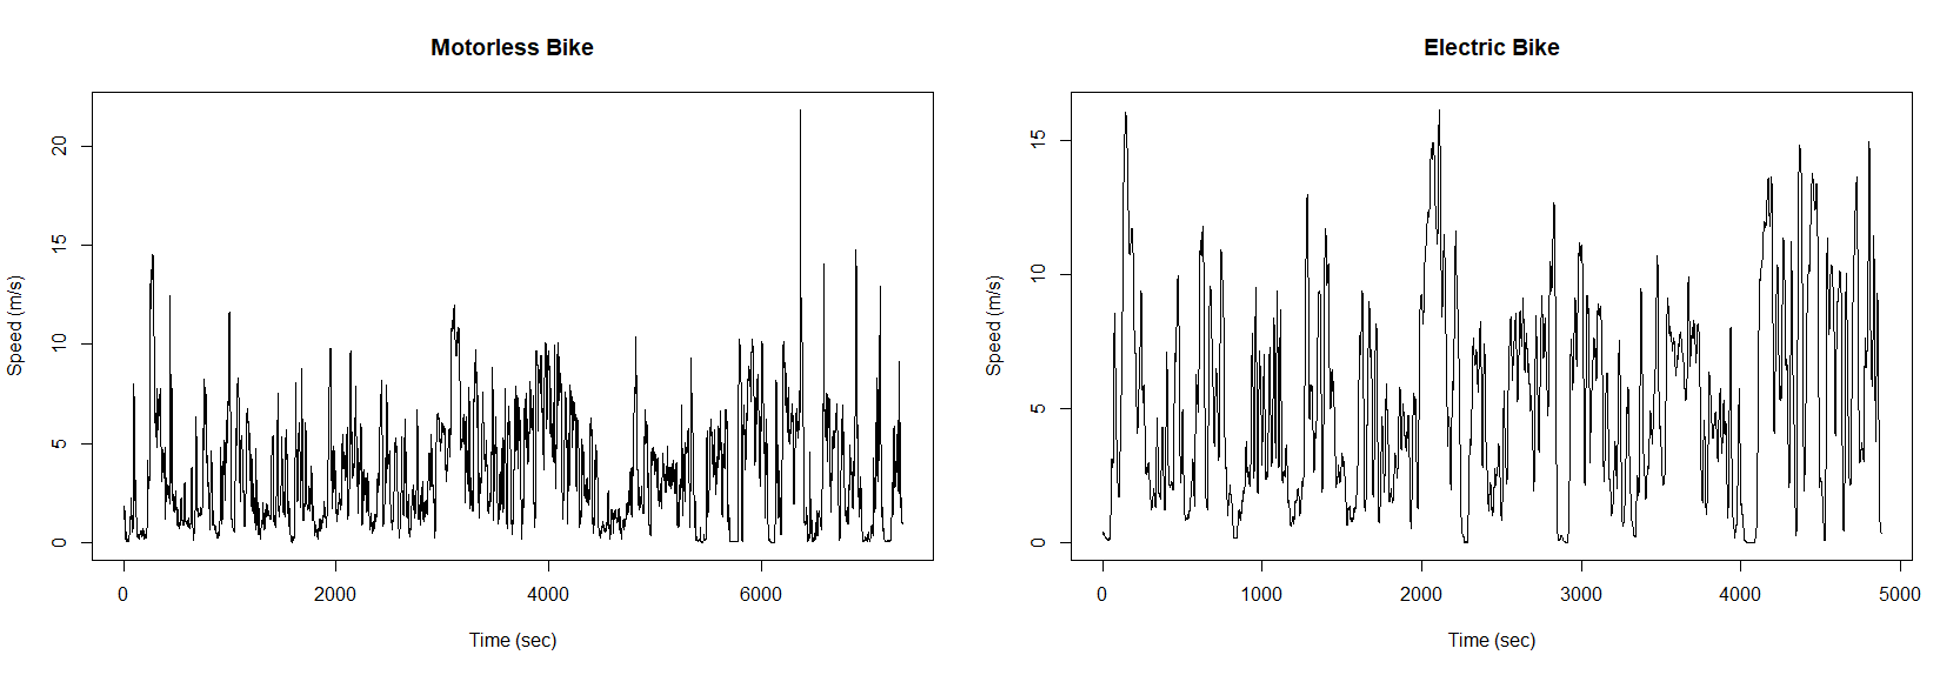
I did two identical 20-mile rides, one on the Dynamic bike (left) and the second on the Juiced bike (right), and recorded the trips using my Strava app.
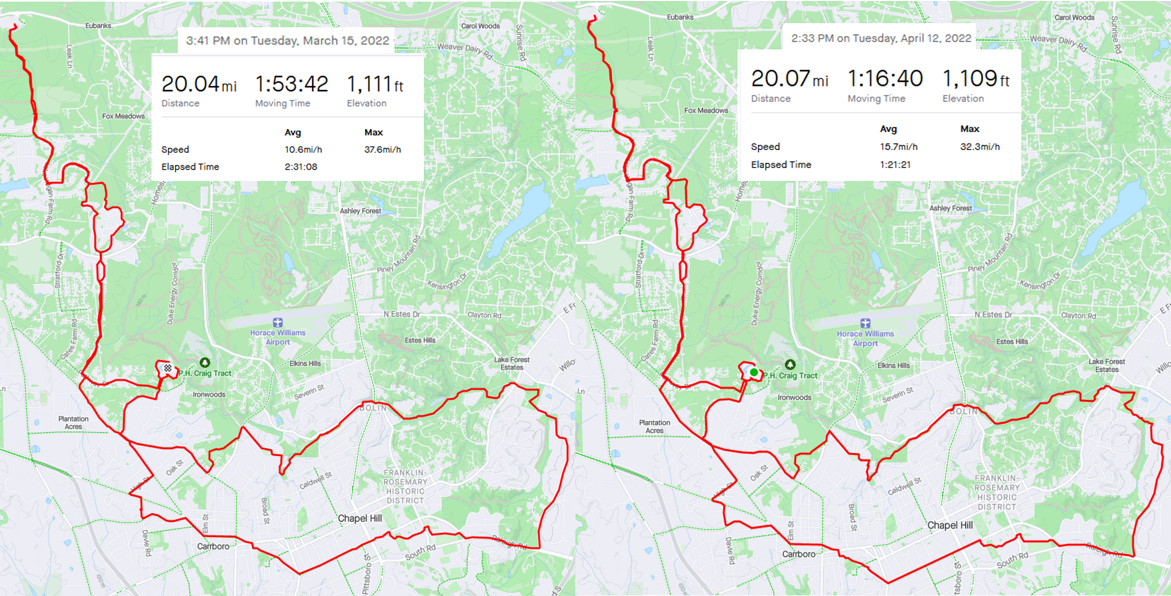
Strava recorded my average speed of 10.6 mph (4.7 m/s) unmotorized and 15.7 mph (7.0 m/s) on the electric bike, giving kinetic energies of 1050 J and 2695 J. The kinetic energy is about 2.6 times higher on the electric bike than the motorless bike.
Strava claimed that my maximum speed unmotorized was 37.6 mph while it was only 32.3 mph on the electric bike, or 13400 J and 11470 J, respectively. I'm not sure I believe these instantaneous maximum speeds. Derivatives are always noisier than integrals, and Stava is calculating the speed by taking very short distances and times.
Riding the electric bike feels faster, but not a lot faster. The Bolin Creek Trail is a pleasant, paved 2.5-mile path populated with pesky pedestrians and other predators limit top speeds. The top half of the big loop at the bottom of the map is the Bolin Creek Trail.
Using the Strava data we can calculate average speeds for each bike along the trail. But I needed to get up a big hill to get to the trail.
Stravanalysis
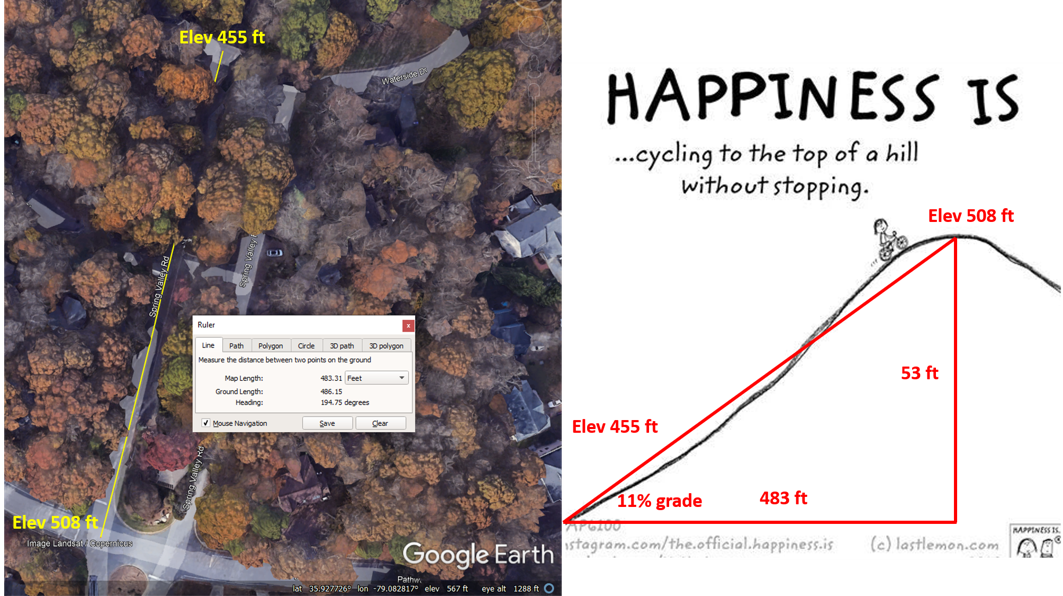
Getting out of our neighborhood means climbing a hill with an 11% grade. If I'm on the Motorless Child there are times when I think, "Ugh, do I have to?" and wind up walking. I can walk the hill at about 3 mph or about 4.5 ft/sec, which means it takes 107 seconds to go up.
I can ride up at about 10 mph (15 ft/sec) on the electric bike, requiring only 32 seconds. Coming back down on either bike I go about 20 mph which takes 16 seconds.
The round trip motorless is 107 + 16 = 128 seconds, and 32 + 16 = 48 seconds electrified. Since velocity = distance / time, the motorless trip averages 7.5 feet / second (5 mph), and motorized is 20 feet / second (13.3 mph).
It seems the big speed difference is in the hills. I put the brakes on coming back down, but if the speed is nearly the same on either bike, the only difference in kinetic energy is due to the difference in mass.
GPX data
Let's do a more careful analysis of the entire trip. If you log into your Strava account (even if you're cheap like me and haven't paid for it), you can download the details of your route. Click on the route, and on the left side you should see something like this:
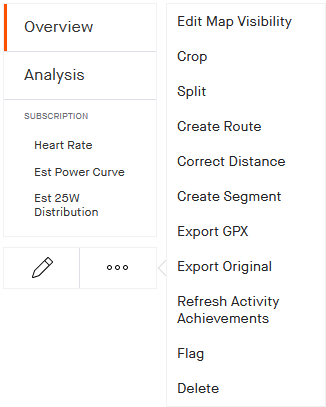
Click on "Export GPX" and save the data. In this format, we only get timestamps, latitude, longitude, and elevation data. The timestamp is in the form 2022-04-12T18:33:38Z, but if you're using Excel there's a nice trick to extract hours, minutes, and seconds from the data.
Create three new columns labeled "Hours", "Minutes", and "Seconds" and then copy a few of the hours into the new column. It only takes about three copies, and then press Ctrl-e . Excel will figure out you want the hours extracted from each timestamp.
Repeat this for the minutes and seconds using the Flash Fill feature to propagate the missing values. Next, convert to seconds in a column labeled "Running time" as 3600 × hours + 60 × minutes + seconds 3600 \times \text{hours} + 60 \times \text{minutes} + \text{seconds} 3600×hours+60×minutes+seconds. I subtracted the first time to get "Corrected time" starting at 0 0 0 seconds.
FIT data
The other option to download the data is in FIT format. Click on "Export Original" and save the file. Next, navigate to the Garmin site "Getting Familiar with FIT" and download the FIT SDK under "Implementing FIT" in Step 1.
Extract the contents of the downloaded file, and then go to the Java folder and find the "FitToCSV.bat" file. Drag and drop your Strava .fit files onto this file to extract the data to .csv format. See franchyze923's YouTube video channel for details.
Use a text editor like Notepad++ to remove all lines that don't start with either "Data,1,record" or "Data,2,record". Remove the first 29 lines, the last 3, and the one line starting with "Definition,2,record,timestamp..." Next, delete extra commas using the Search and Replace function. The last step is to merge alternating lines by replacing "m/s,\n" with "m/s,".
In Notepad++, you can find the special characters by clicking "View" → \rightarrow → "Show Symbol" → \rightarrow → "Show All Characters". To replace the special characters "LF" and "CR" use the Extended search mode and search for "m/s,\r\n" to replace carriage returns and line feeds.
Each line should contain
Data,1,record,position_lat, ..., Data,2,record,timestamp,...
in comma-delimited format. Import the data into your favorite spreadsheet program (pyspread!) as a comma-delimited file. Now you can copy the columns "timestamp", "distance", "enhanced_speed", and "enhanced_altitude" into a new spreadsheet.
In the column to the right of "timestamp" I subtracted the first timestamp value from all of the remaining times to get times beginning at time 0 0 0, separated by one-second intervals.
In R load libraries readxl and ggplot2 to import the data for both trips as
ebike <- readxl("Electric.xlsx")
mbike <- readxl("Motorless.xlsx")
Let's do some simple checks,
> tail(ebike$Distance,1)/1000*0.621371
[1] 20.0744
> tail(mbike$Distance,1)/1000*0.621371
[1] 17.97014
The distance is correct for the e-bike trip, but a couple of miles short for the other bike. Checking speeds,
> max(ebike$Speed)
[1] 14.678
> max(mbike$Speed)
[1] 12.989
Both seem lower than expected. For the motorless bike, the time was 1 : 53 : 42 = 6822 1:53:42 = 6822 1:53:42=6822 seconds, but the last data entry is 6453 6453 6453 seconds. For the electric bike, the total time was 1 : 16 : 40 = 4600 1:16:40 = 4600 1:16:40=4600 seconds, but the data showed time out to 4881 4881 4881 seconds. The elevations don't seem to be right, either.
The Prosecco and Pie Interruption
The first entry for the Motorless Child ride was 19:41:07Z and the last was22:12:15Z which would mean the total trip time was 2:31:08. According to Strava, my moving time was 1:53:42, so how did I lose almost 40 minutes?
This was quite a puzzle until I remembered I'd done the ride the day after my birthday, and had stopped off at Sara and Max's house for the leftover Prosecco and pie from the party.
Looking through the data, I found a half-hour gap in the timestamps, and the latitude and longitude show up in exactly the right place. Here's a picture of the ride using the online GPX2KML converter. Drag and drop the KML file onto Google Earth to plot the route.
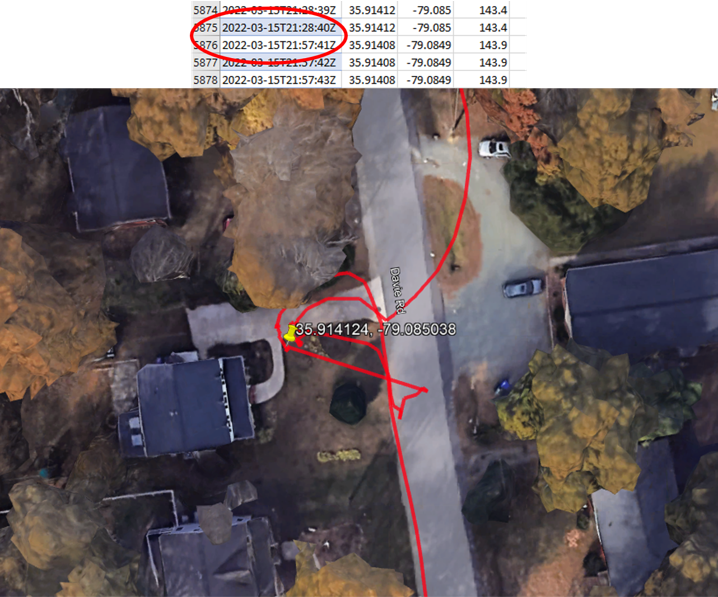
Strava gives the total moving time, so the remaining missing time is probably due to stops at traffic lights.
Getting up to Speed
Read the spreadsheet data into R and calculate the distances between latitude/longitude points. From the distance data, calculate speeds at each step. I used the R library geosphere, (Tools
→
\rightarrow
→ Install Packages) and the function distGeo to get distances in units of meters.
Dividing each step length by the step time gives the speed in meters per second. Since Strava gives speeds in miles per hour, I converted the derived speeds to mph by multiplying by 2.237. Checking the maximum speeds for each trip, I found
> max(ebike$Speed)*2.237
[1] 41.46165
and
> max(mbike$Speed)*2.237
[1] 136.2689
which seems like a perfectly reasonable top speed for a bike with no motor. Or, it could be due to the Prosecco and Pie Interruption. We can locate the maximum speed using
> which.max(mbike$Speed)
[1] 5790
which gives the latitude and longitude: 35.91322 N , − 79.0821 E 35.91322 \; N, -79.0821 \; E 35.91322N,−79.0821E,
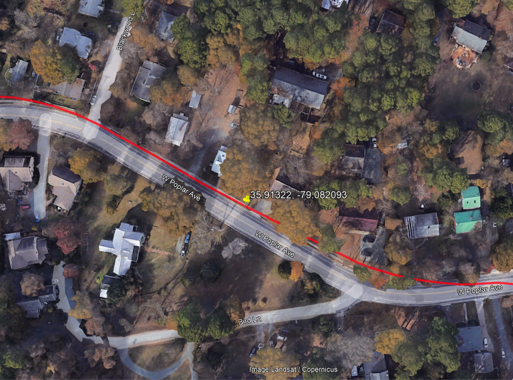
a position on W. Poplar just prior to the Prosecco and Pie Interruption.
Smooooth
The problem is GPS data isn't precise. Notice how I seem to have cut the corner on W. Poplar just before hitting top speed. If there's an error that puts my position behind where I actually am at one timestamp, and ahead of where I am at the next timestamp, then the apparent speed can be too high.
One way to fix this would be to search for and remove outliers. A post on the R-bloggers site describes three methods for removing outliers, and the package outliers could be installed, but it implements the decidedly bourgeois Dixon Q test. One prefers the modified Thompson Tau test (see Michele Rienzner's Matlab version).
A simpler solution is to smooth the data by averaging over a moving window. Suppose you want a window width of k = 5 k = 5 k=5. To smooth the data, take the average of values 1 1 1 through 5 5 5 and put it in the first position, 2 − 6 2-6 2−6 in the second, and so on.
Rather than writing a function to compute the moving window average, you can install the package zoo and use the rollmean function. This shortens the vector by
k
−
1
k-1
k−1, so a simple fix is to calculate the mean of the first
k
−
1
k-1
k−1 values and replicate them. Here's the smoothing function:
vecSmooth <- function(v,k){
  # Extend v by the mean of the first k values
  mean_v <- mean(v[1:k-1])
  # Replicate the first k-1 averages and attach to the beginning
  v <- c(repmat(mean_v,1,k-1), v)
  # Apply rolling average smoother over k values
  vec <- rollmean(v,k)
  return(vec)
}
The plots of speed against time show how the trips were going.
Savitzky-Golay Smoothing
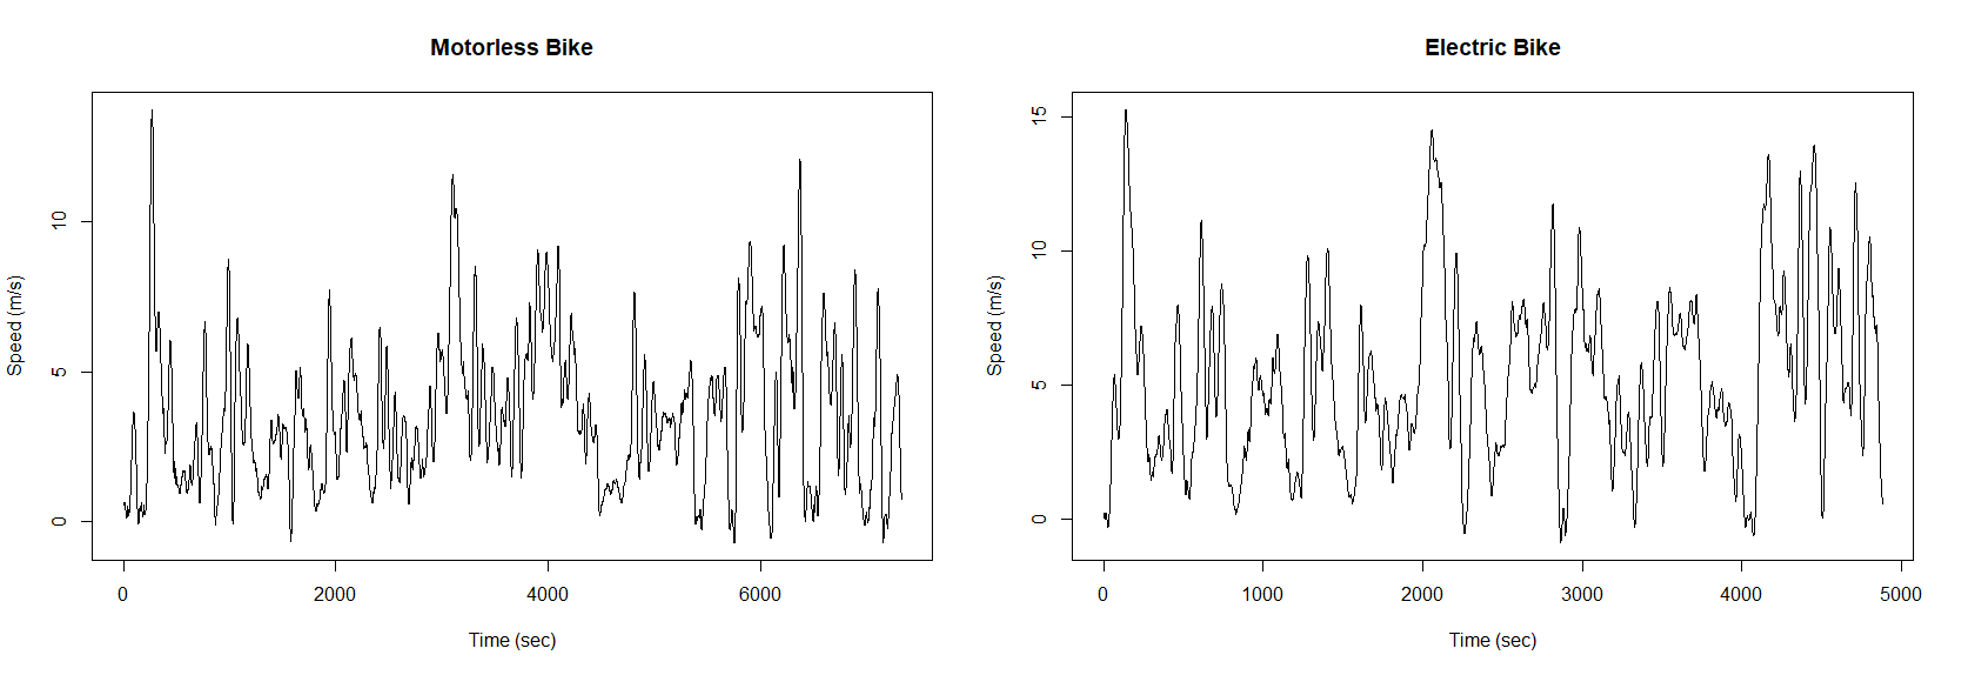
The simple smoothing technique above reduces the magnitude of the outliers, but the speeds seem to jump around unnaturally. An improvement on the simple smoothing is to use the Savitzky-Golay filter which fits an n t h − n^{th}- nth−degree polynomial to a 2 m + 1 2m+1 2m+1 wide moving window.
Even this method has been called into question in the paper, "Why and How Savitzky–Golay Filters Should Be Replaced" by Schmid, Rath, and Diebold, but for our purposes, the S-G filter should be sufficient. It's available in the pracma library as function savgol, and the smoothed vector is the same length as the original.
Using 2 m + 1 = 101 2m+1 = 101 2m+1=101, the smoothed speed data looks like this:
Speeeeed
We can generate histograms of the speeds for each bike using the rolling averages.
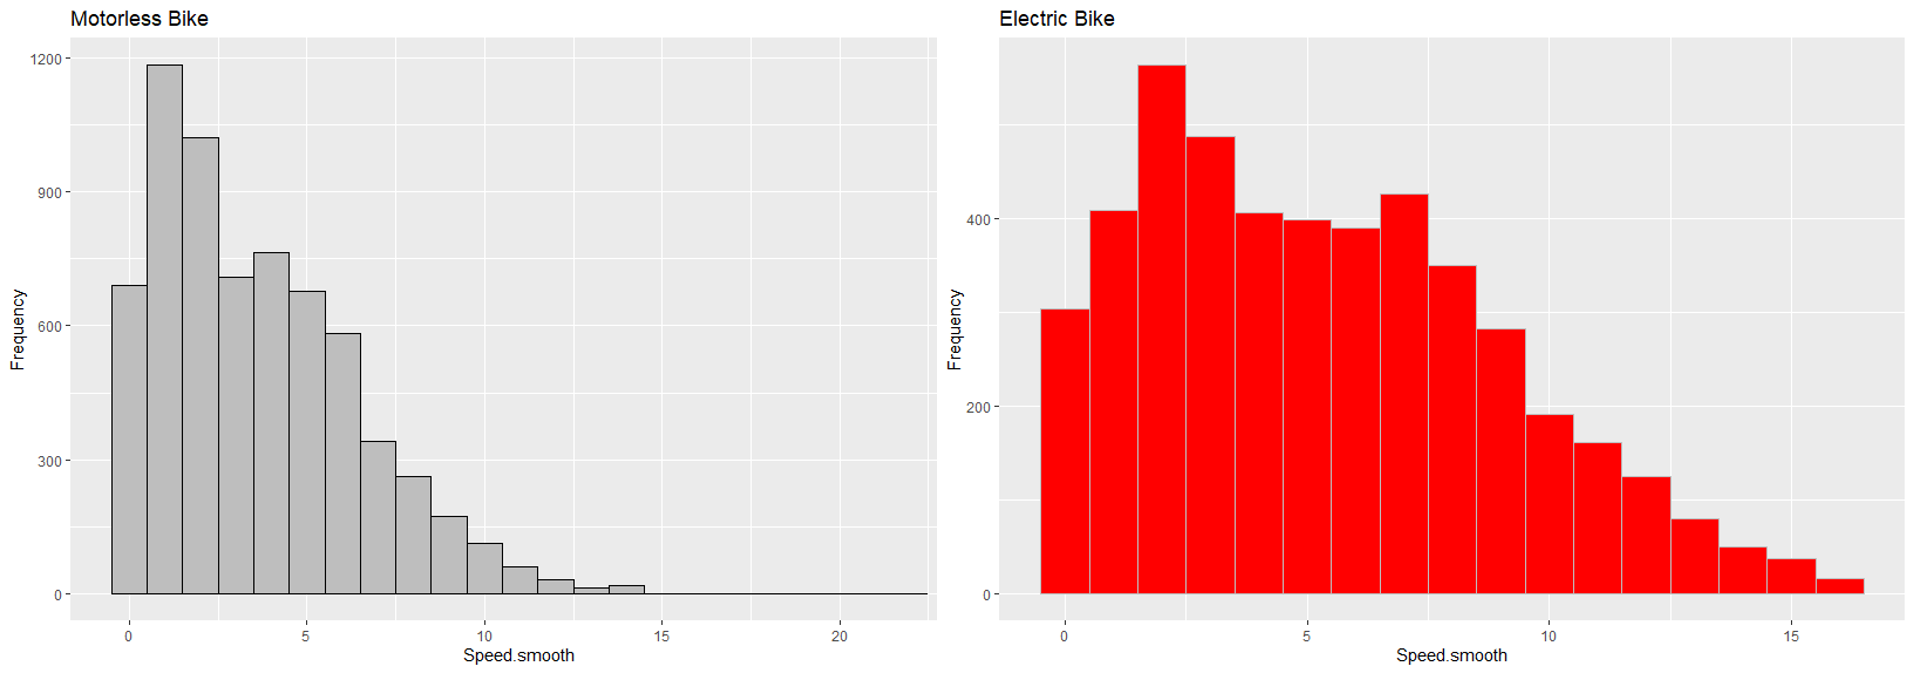
The maximum speed for the electric bike is 16.12635 m s = 36.07 mph 16.12635 \frac{m}{s} = 36.07 \text{ mph} 16.12635sm=36.07 mph, and for the motorless bike it's 21.81978 m s = 48.8 mph 21.81978 \frac{m}{s} = 48.8 \text{ mph} 21.81978sm=48.8 mph, so still a bit inaccurate, but better. In the histogram, the bar at 22 m s 22 \frac{m}{s} 22sm has a frequency of 1 1 1, making it too small to see in the plot.
The top speed on the electric bike is slightly higher than the top speed on the motorless bike, but the main difference is that the "cruising speed" is shifted higher for the electric bike.
The median speed on the electric bike was 4.9 m s 4.9 \frac{m}{s} 4.9sm, but only 3.1 m s 3.1 \frac{m}{s} 3.1sm on the other bike. This is enough to make the kinetic energy on the electric bike about 2.5 2.5 2.5 times greater than the mechanical bike.
Grit and Determination, but mostly Grit
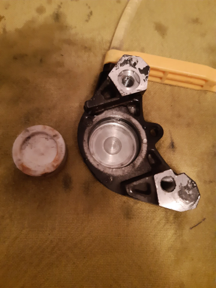
When I replaced the pads on the electric bike I noticed a lot of grit buildup on the calipers. This is a photo of a disassembled Tektro hydraulic brake. When you pull the brake lever, hydraulic fluid flows behind the piston, and the piston presses against the pads which engage the disk.
On my bike, grit had gotten into the cylinder preventing one side from fully extending leading to uneven wear of the pad on that side. I should probably clean the bike and especially the brakes more often.
You've Got Potential
Kinetic energy is the energy of motion, but there's another form of energy you encounter during the ride - potential energy. Potential energy is the energy available due to gravity.
After you've climbed a steep hill, you've got the potential to zip down the other side by letting gravity do most of the work. The formula for potential energy is
P E = m g h PE = mgh PE=mghwhere m m m is the combined mass of the bike and rider, g = 9.81 m s 2 g = 9.81 \frac{m}{s^2} g=9.81s2m is the acceleration due to gravity, and h h h is the height or elevation. Here's an elevation plot of my ride on the electric bike.
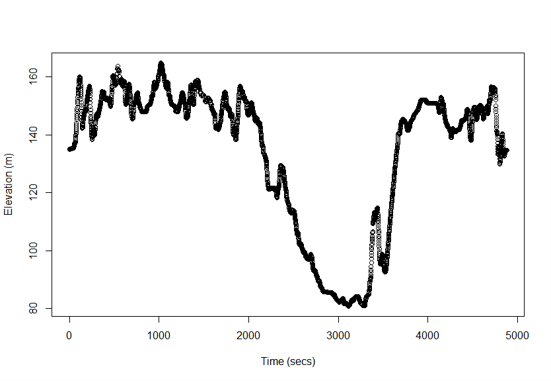
Since the rides start and end at the same place the total potential energy for the trip is zero, but that doesn't help going up a steep hill. Right at the beginning, the elevation is about 135 m 135 \; m 135m and quickly climbs to about 160 m 160 \; m 160m so I had to overcome a potential of
P . E . = ( m rider + m bike ) k g × 9.81 m s 2 × 25 m = 95 k g × 9.81 m s 2 × 25 m = 23300 k g ⋅ m 2 s 2 = 23300 J \begin{aligned} P.E. &= (m_{\text{rider}} + m_{\text{bike}}) kg \times 9.81 \frac{m}{s^2} \times 25 m \\ &= 95 \; kg \times 9.81 \frac{m}{s^2} \times 25 m \\ &= 23300 \frac{kg \cdot m^2}{s^2} = 23300 \; J \end{aligned} P.E.=(mrider+mbike)kg×9.81s2m×25m=95kg×9.81s2m×25m=23300s2kg⋅m2=23300Jto get up the hill. In the middle of the plot is a long decline as I rode beside Bolin Creek followed by a climb and descent on Greenwood Rd and then a long haul up Raleigh Rd towards UNC.
All That Energy
Using the minimum elevation as the zero point for potential energy, we can plot kinetic, potential, and total energy on the same graph for each bike.
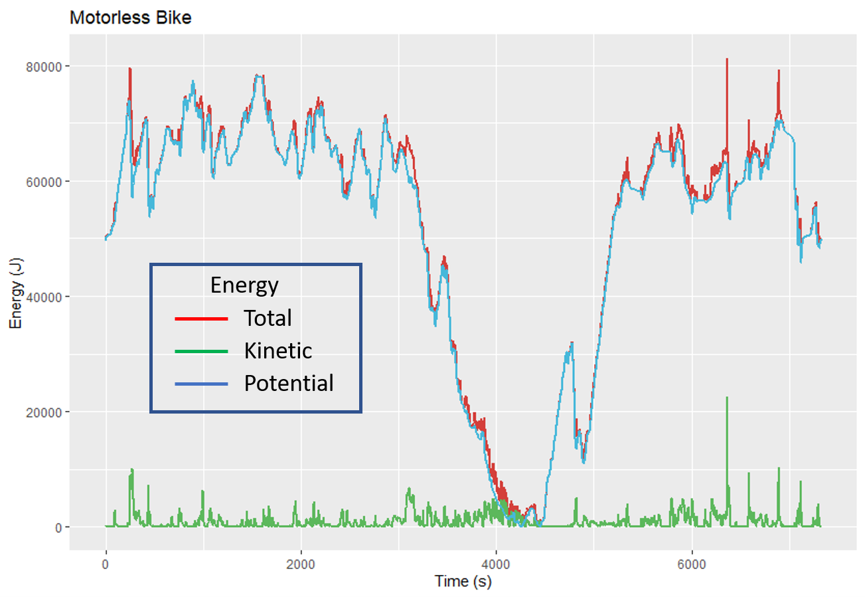
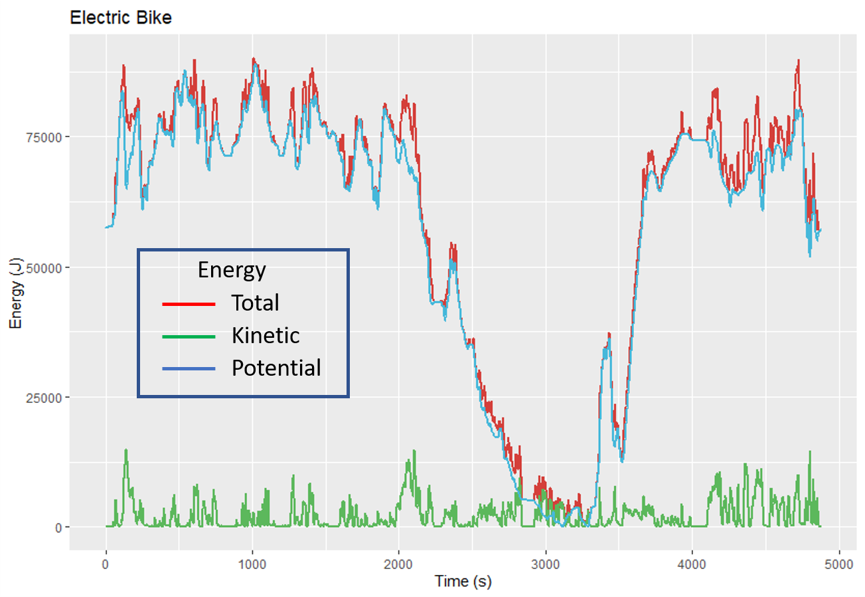
The potential energy is much greater than the kinetic energy, so you've got to put in a lot of effort to climb those hills. Right at the start, the hill getting out of the neighborhood requires at least 20 K J 20 \; KJ 20KJ to overcome the gravity potential, and the long climb up Raleigh Road (starting at ~5000 seconds on the motorless bike and 3500 seconds electric) takes about 50 K J 50 \; KJ 50KJ.
Let's take a look at the times coming down the Bolin Creek path. In Google Earth, I put pins at the beginning and end of the path,
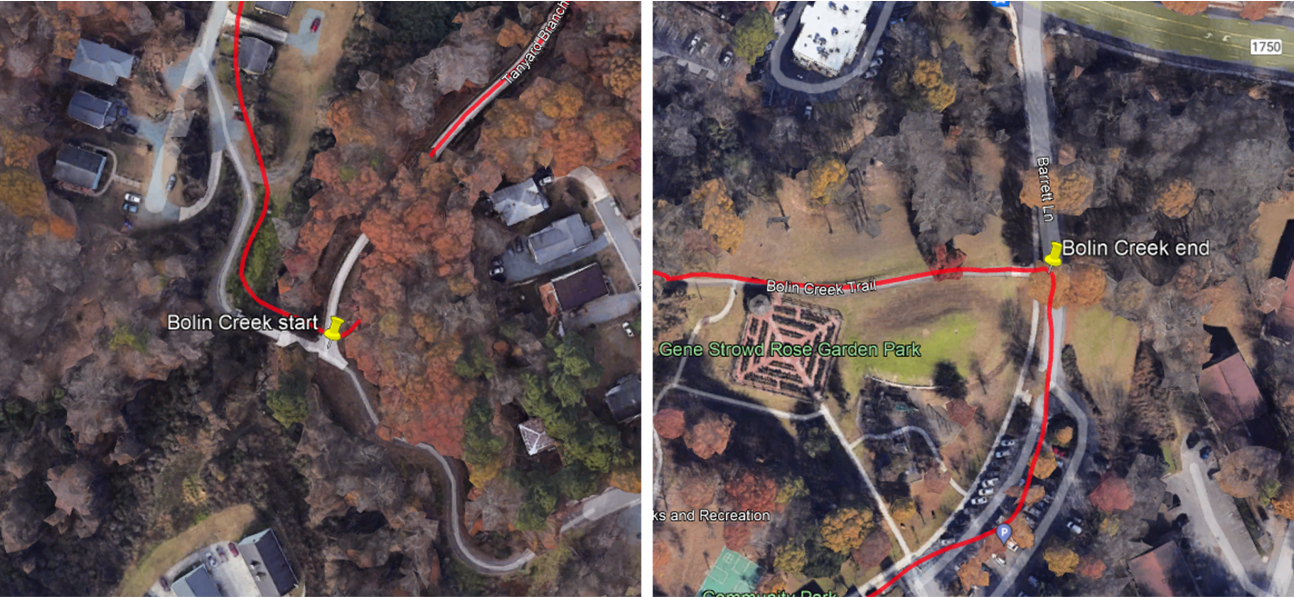
and put the longitude and latitude for each point into a variable:
> Bolin_start <- cbind(-79.066146, 35.917882)
> Bolin_end <- cbind(-79.032094, 35.927077)
The function cbind puts the numbers together in separate columns. Next, I put all of the longitude and latitude points from the ride together as a matrix of points:
> mLL <- cbind(mbike$Longitude, mbike$Latitude)Using the distm function from the geosphere package, we can find the point on the route that is closest to the start and end points of the Bolin path.
> which.min(distm(mLL,Bolin_start))
[1] 3264
> which.min(distm(mLL,Bolin_end))
[1] 3936
Using this, we can calculate the time required to go along the path (in seconds):
> mbike$Corrected.time[3936] - mbike$Corrected.time[3264]
[1] 720
which is exactly 12 minutes. The e-bike was a bit faster, taking only 10.8 minutes. The function timeBtwnPoints in the R code calculates travel time with this method.
Using this method on the Spring Valley hill, the time for the motorless bike was 98 seconds, but the e-bike did it in only 28 seconds.
Two other tough hills are the ones on Houston and Raleigh roads. The Dynamic bike took 152 seconds and 345 seconds up these hills, but on the CrossCurrent X the times came down to 36 seconds and 150 seconds, respectively.
It's not surprising that the e-bike climbs hills faster than the motorless bike, but the data shows that there isn't a big difference in the downhills. The fact the electric bike is 50% faster overall comes almost entirely in the uphill times.
The Power of Knowing
Our analysis revealed several interesting insights about the differences between electric and mechanical bikes:
- Speed Impact: While the electric bike's average speed was about 50% higher (15.7 mph vs 10.6 mph), this difference came almost entirely from climbing hills faster. Downhill speeds were remarkably similar between the bikes.
- Energy Differences: The electric bike's higher average speed resulted in kinetic energy about 2.5 times greater than the mechanical bike. This helps explain the increased brake pad wear - when you need to stop, there's significantly more energy to dissipate.
- Hill Performance: The most dramatic differences showed up in hill climbing times:
- Spring Valley hill: 28 seconds (electric) vs 98 seconds (mechanical)
- Houston Road hill: 36 seconds vs 152 seconds
- Raleigh Road climb: 150 seconds vs 345 seconds
Interested in analyzing your own riding? Here are some suggestions:
- Use Strava to track identical routes on different bikes or under different conditions. Remember to download your routes in GPX format for the most complete data.
- Clean your brake calipers regularly, especially if you're riding an electric bike. The increased energy means more heat and wear, which can trap grit and debris.
- Consider your route choices differently for each bike. What takes 10 minutes to climb on a regular bike might only take 3 minutes with electric assist, opening up new route possibilities.
- Track your brake pad wear. How quickly do they wear down under different riding conditions or seasons?
- Calculate your own energy expenditure using the formulas and code provided. How much potential energy do you overcome on your regular routes?
The next time you're zooming down a hill or grinding up one, remember that it's not just about speed - it's about energy. Whether that energy comes from your legs, a battery, or gravity itself, understanding these principles can help you ride more efficiently and maintain your bike more effectively.
Download the R code from Github to use the Strava data collected on your rides.
Image credits
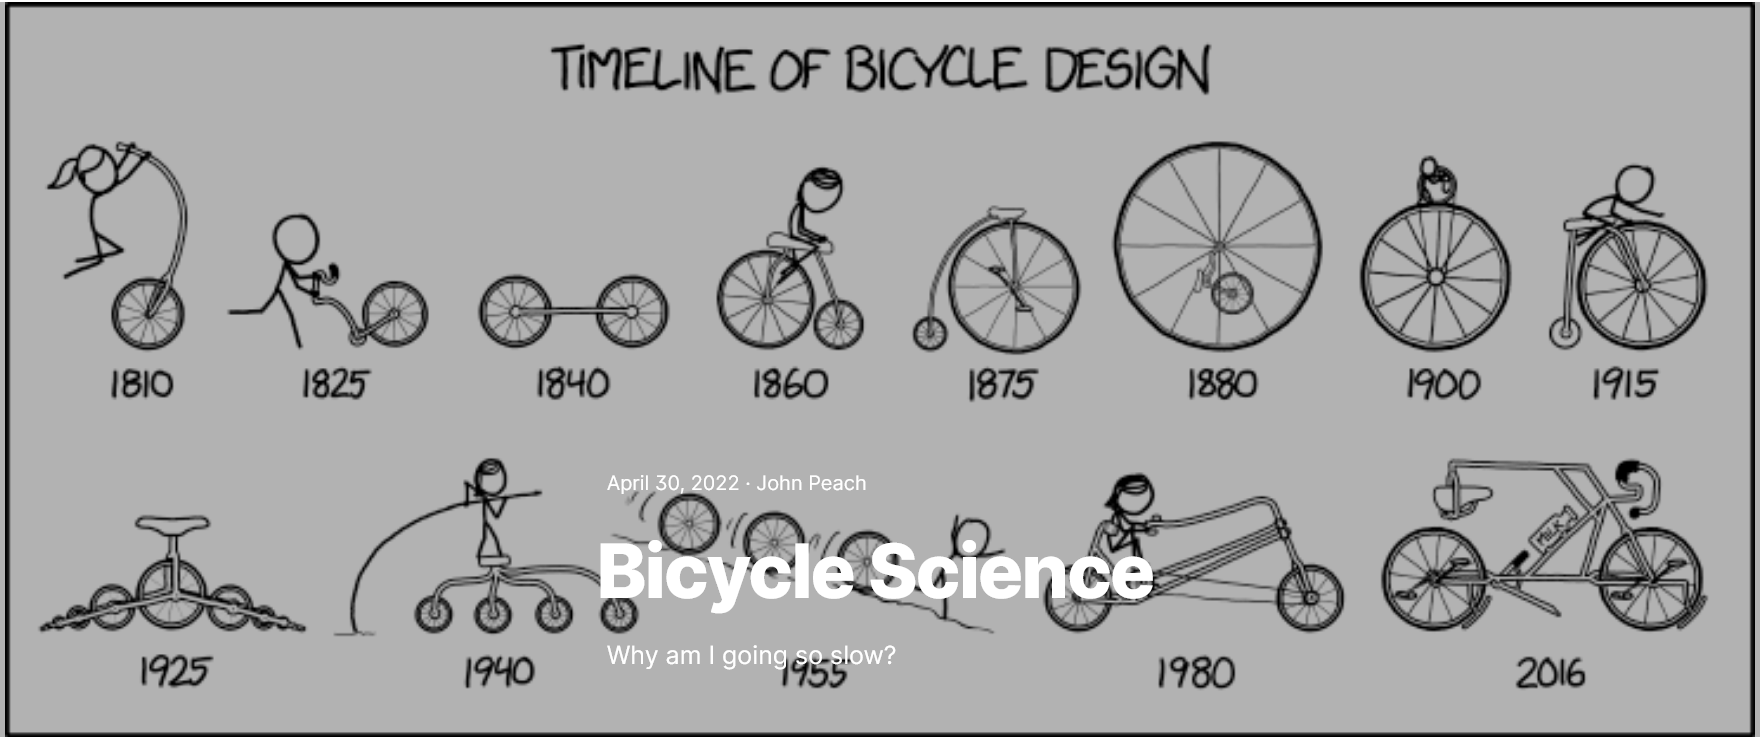
Hero: Timeline of Bicycle Design, Randall Munroe, XKCD.
Happiness Is: Lisa Swerling & Ralph Lazar, Last Lemon, 2015
Code and Software
bicycleScience.r - Kinetic and potential energy derived from Strava data for bicycle rides: dataPrep, vecSmooth, histSpeeds, plotSpeeds, plotEnergy, plotElevation, timeBtwnPoints.
- Notepad++ - Notepad++ is a free (as in “free speech” and also as in “free beer”) source code editor and Notepad replacement that supports several languages.
- LibreOffice - LibreOffice is a powerful and free office suite, with a clean interface and feature-rich tools help you unleash your creativity and enhance your productivity.
- pyspread is a non-traditional spreadsheet application that is based on and written in the programming language Python. The goal of pyspread is to be the most pythonic spreadsheet.
- R and RStudio - R is a language and environment for statistical computing and graphics. RStudio is an integrated development environment (IDE) for R. It includes a console, syntax-highlighting editor that supports direct code execution, as well as tools for plotting, history, debugging and workspace management.
References and further reading
- Physicists Solve the Mystery of the Light-Speed Cyclist Popular Mechanics explores the intriguing physics behind a cyclist approaching light-speed, delving into concepts of relative motion and perception.
- Determinants of Cycling Performance: A Review of the Dimensions and Features Regulating Performance in Elite Cycling Competitions This comprehensive review in Sports Medicine - Open examines various factors influencing elite cycling performance, including physiological, tactical, and environmental aspects.
- Benefits, Risks, Barriers, and Facilitators to Cycling: A Narrative Review Published in the British Journal of Sports Medicine, this article discusses the health benefits of cycling, associated risks, and factors that encourage or hinder participation.
- The Science of Cycling: Bicycle Physics & History The Exploratorium provides an insightful overview of the physics and history of bicycles, covering topics like gear ratios, frame materials, and the forces that keep bicycles upright.
- The Bicycle: A Marvel of Physics and Engineering This article from the Illinois Science Council delves into the physics principles that make bicycles efficient, including discussions on rolling resistance and energy conservation.
- Improving Cycling Performance: How Should We Spend Our Time and Money A study in Sports Medicine analyzing the physiological and mechanical factors affecting cycling performance, offering insights into effective training and equipment investments.
- Cycling Position Optimisation: A Systematic Review of the Impact of Body Position on Performance and Risk This systematic review in the Journal of Sports Sciences examines how different cycling positions affect performance and injury risk, providing guidance on optimal positioning.
- Using Field-Based Data to Model Sprint Track Cycling Performance Published in Sports Medicine - Open, this research utilizes real-world data to model sprint cycling performance, highlighting the importance of various energy pathways.
- The Art of Taking It Slow The New Yorker profiles Grant Petersen, a bicycle designer advocating for a leisurely, functional approach to cycling, challenging the mainstream focus on speed and technology.
- How to Keep a Riderless Bike From Crashing This article from Science investigates the mechanisms that allow bicycles to remain upright without a rider, exploring the physics of stability and motion.
📬 Subscribe and stay in the loop. · Email · GitHub · Forum · Facebook
© 2020 – 2025 Jan De Wilde & John Peach