
keywords: economic growth, Stefan-Boltzmann law, waste heat, exponential growth, energy consumption
Why do economists want us to live in a searing, burning flaming apocalyptic hellscape?
Profits.
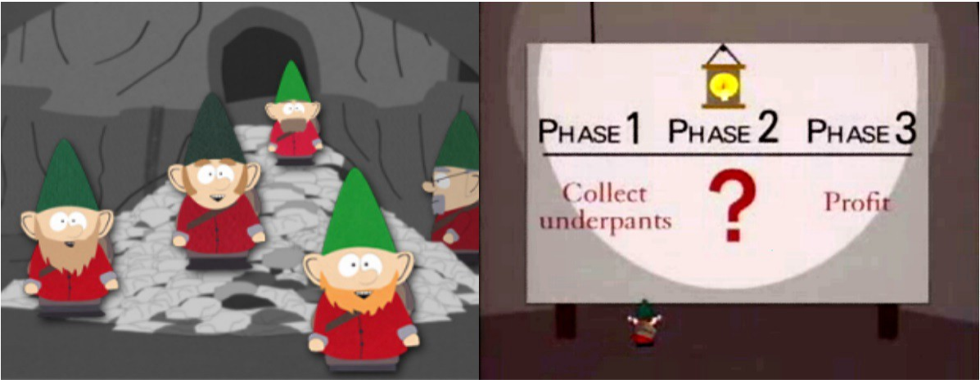
In 1972, an MIT study called The Limits to Growth was published, warning
The earth’s interlocking resources – the global system of nature in which we all live – probably cannot support present rates of economic and population growth much beyond the year 2100, if that long, even with advanced technology.
Here, I'll show how continued economic growth could turn the Earth into an inferno as hot as the surface of the Sun.
World GDP
The World GDP (Gross Domestic Product) has been growing quite nicely for decades
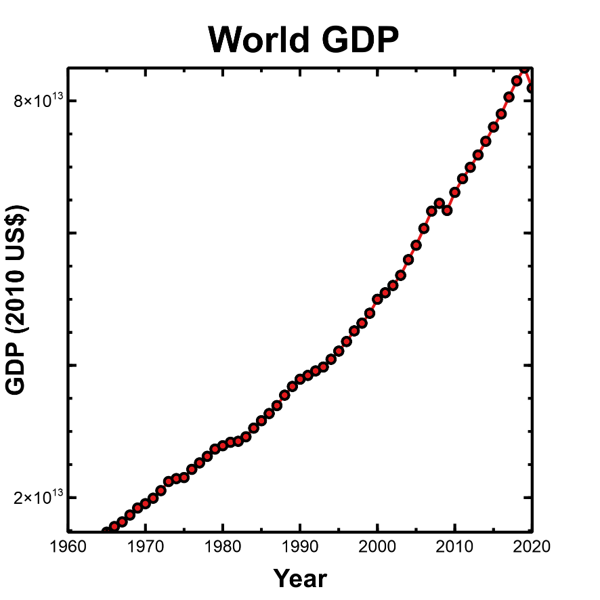
other than a couple of hiccups in 2008 and 2019-2020. Another way to look at the data is to plot the logarithm of GDP. If you raise a number to a power, 1 0 2 = 100 10^2 = 100 102=100 then the logarithm of the answer is the exponent, log 10 ( 100 ) = 2 \log_{10}(100) = 2 log10(100)=2.

If you put your money in a savings account earning 2% per year, then the equation for how much you have after t t t years is
P ( t ) = P 0 ( 1 + 0.02 ) t P(t) = P_0 (1+0.02)^t P(t)=P0(1+0.02)twhere P 0 P_0 P0 is the initial deposit, and 0.02 0.02 0.02 is the interest rate. The rate of increase is
P ( t ) P 0 = ( 1 + 0.02 ) t \frac{P(t)}{P_0} = (1+0.02)^t P0P(t)=(1+0.02)tand if we take the logarithm (base 10) on both sides,
log 10 ( P ( t ) P 0 ) = t log 10 ( 1.02 ) = 0.0086 t . \log_{10} \left( \frac{P(t)}{P_0} \right) = t \log_{10} (1.02) = 0.0086 t. log10(P0P(t))=tlog10(1.02)=0.0086t.By plotting the logarithm of the money in your bank account you'll see a perfectly straight line with a slope of 0.0086 0.0086 0.0086.
The World economy is growing like your bank account, although it's not a perfectly steady 2% per year. Before 1973, the slope was a little steeper than in the period from 1973 to 2019, but the linear fits to both segments are remarkably good.
The log 10 ( G D P 2019 ) = 13.93 \log_{10}(GDP_{2019}) = 13.93 log10(GDP2019)=13.93 and the log 10 ( G D P 1973 ) = 13.35 \log_{10}(GDP_{1973}) = 13.35 log10(GDP1973)=13.35, so over 46 years the logarithm of the GDP increased by 0.58 0.58 0.58, or 0.0126087 0.0126087 0.0126087 per year.
Since
1 0 0.0126087 = 1.029458 10^{0.0126087} = 1.029458 100.0126087=1.029458then the World economy grew by an average of 2.9% per year. Great!
World Energy
The log plot of total World energy consumption over the same period looks similar.
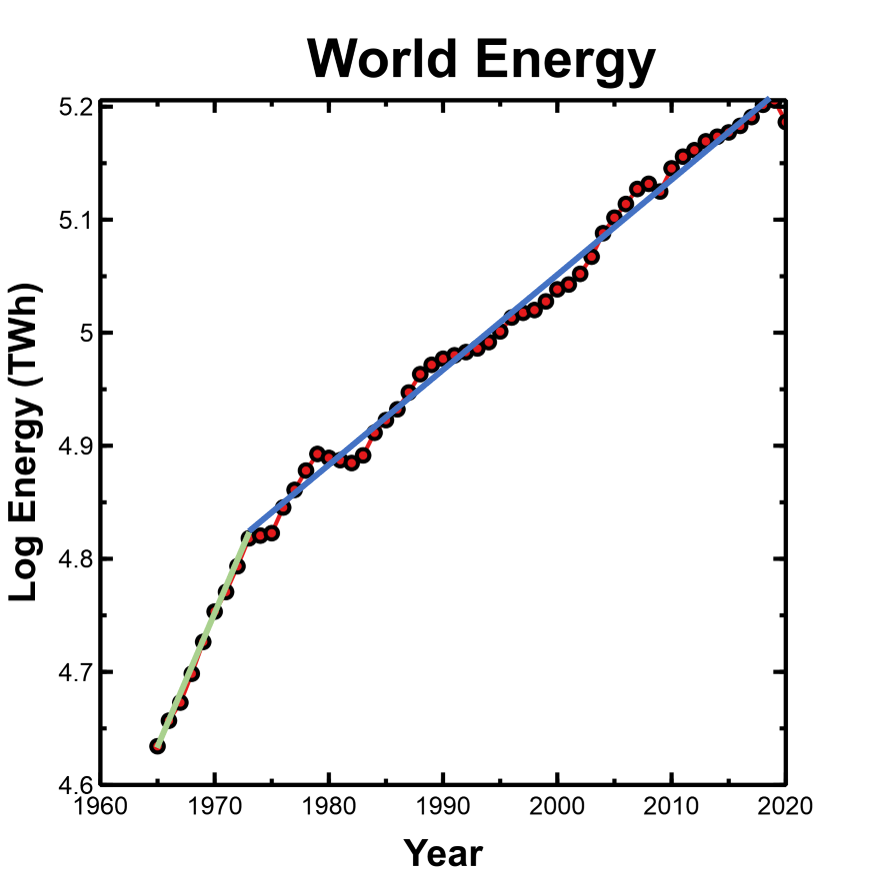
The linear fit isn't quite as good, but the trend is still there. The log of energy consumption in 2019 was 5.21 TWh, and in 1973 it was 4.82 TWh, so the average per year was 0.008423774, and
1 0 0.008423774 = 1.019586 10^{0.008423774} = 1.019586 100.008423774=1.019586or just a bit under 2% growth per year.
GDP and Energy
If we plot log GDP against log energy, the fit is nearly linear.
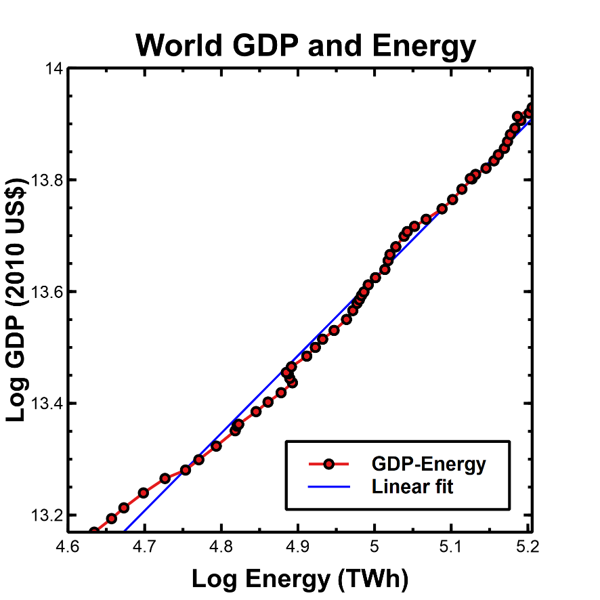
But, as anyone who doesn't understand statistics quite well enough will be happy to tell you, "Correlation doesn't imply causation."
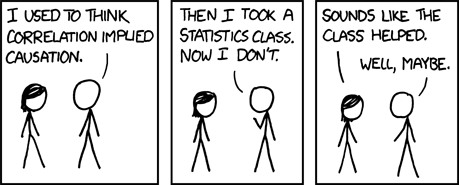
For every aphorism, there's a counter-aphorism. In this case, it's "Where there's smoke, there's fire," meaning if you've got a really good fit (correlation), you'd better start considering causation.
Tim Garrett at the University of Utah has his head in the clouds because he's a climate scientist specializing in clouds, but he took a down-to-Earth look at the correlation between GDP and energy. In 2014, he published "Long-run global economic growth" where he considered the role of energy in the economy. He wrote,
The core finding is that economic wealth or capital is not a static quantity that simply exists, but rather it requires continual energy consumption for its sustenance.
He found that 7.1 Watts of power are needed to maintain $1000 of accumulated wealth. Economic growth requires more energy. In his 2014 paper, "Long-run evolution of the global economy: 1. Physical basis", he described the economy as a thermodynamic heat engine meaning we use energy to generate wealth.
Energy can't be created or destroyed, so eventually, all of this wealth-generating energy gets converted to a form that is no longer useful. The useless form of energy is waste heat.
Why does the economy need energy? Imagine if we suddenly had no access to external energy sources and had to rely entirely on our own physical energy. All vehicles would stop running, all industrial processes would end, and homes and businesses wouldn't have any electrical power.
Nice economy youse got there. Shame if sumtin' was to happen to it.
The Stefan-Boltzmann Law
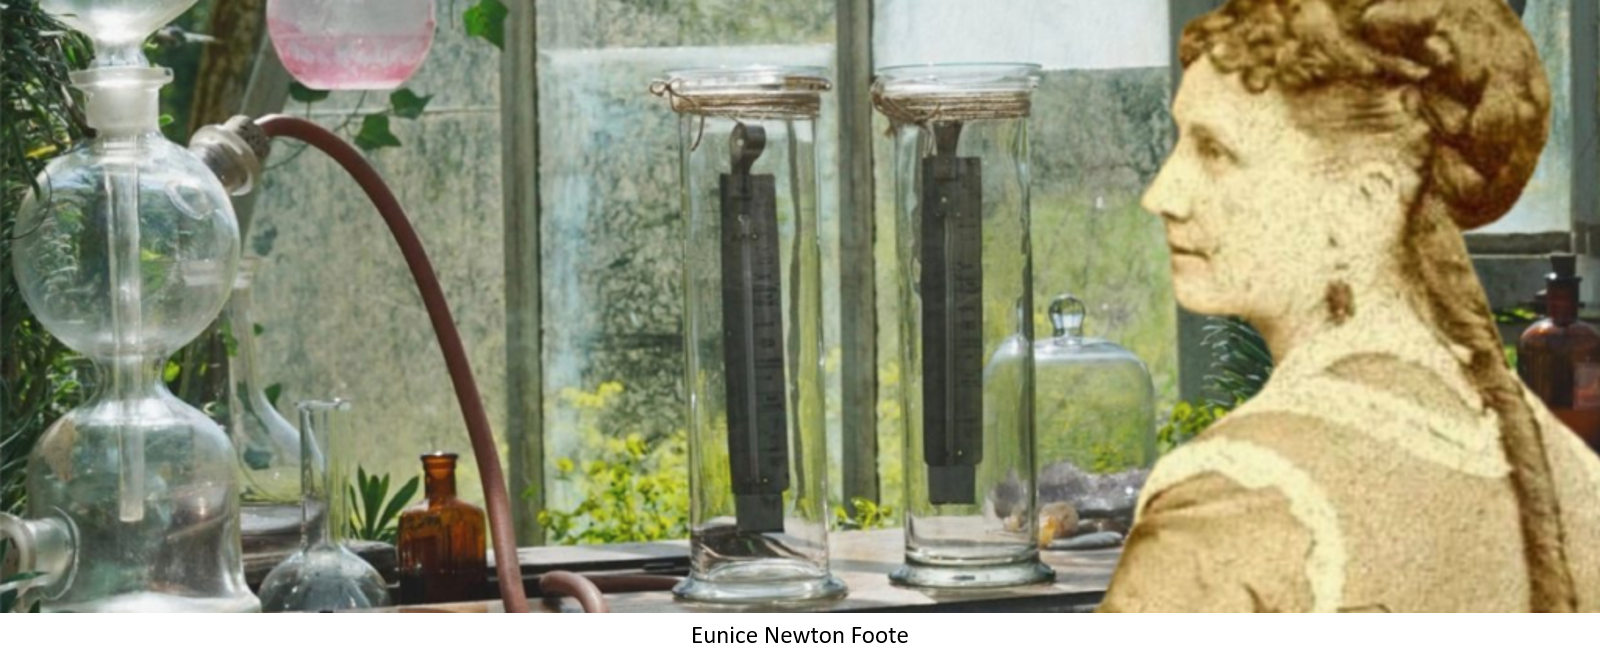
In 1856, Eunice Newton Foote presented a paper to the American Association for the Advancement of Science (AAAS), Circumstances affecting the Heat of the Sun's Rays, the first paper to relate carbon dioxide concentration in the atmosphere to temperature.
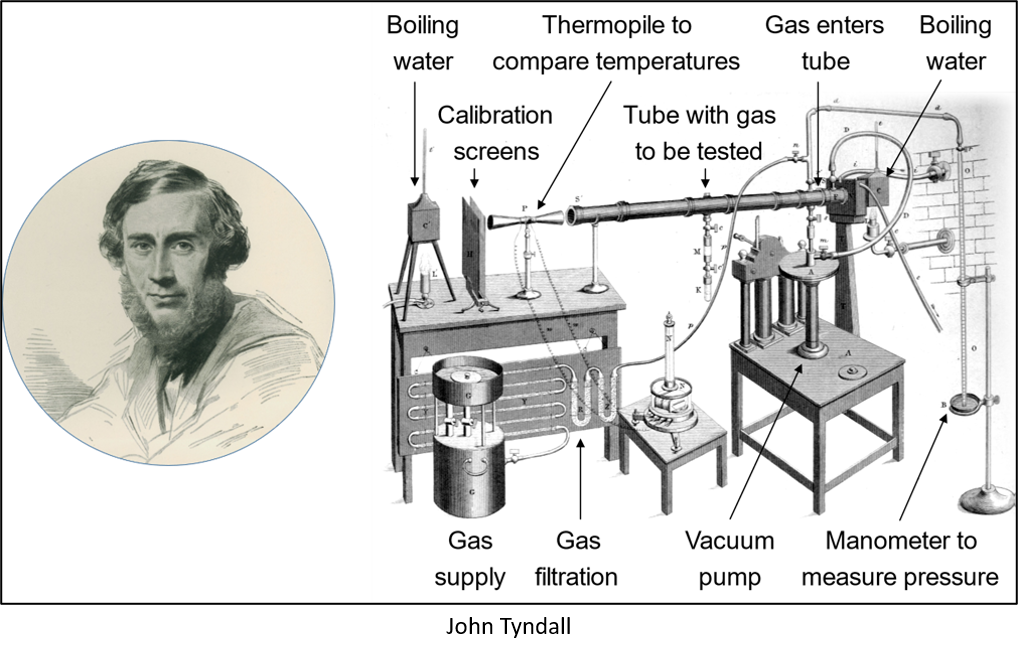
Three years later, Irish physicist John Tyndall independently rediscovered Foote's work, using a ratio spectrophotometer, and began the era of climate science.
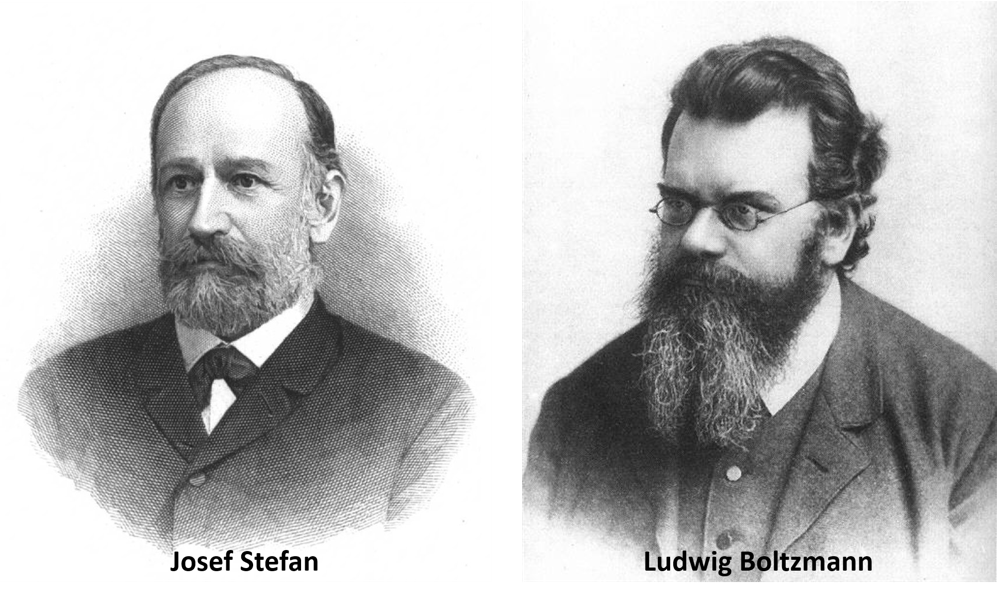
In 1877, Josef Stefan derived the physical law describing the relationship between radiation and temperature,
j ∗ = σ T 4 j^* = \sigma T^4 j∗=σT4and in 1884, Ludwig Boltzmann derived the law from first principles, finding the constant σ \sigma σ to be
σ = 2 π 5 k 4 15 c 2 h 3 ≈ 5.67 × 1 0 − 8 W m 2 ⋅ K 4 \sigma = \frac{2 \pi^5 k^4}{15 c^2 h^3} \approx 5.67 \times 10^{-8} \frac{W}{m^2 \cdot K^4} σ=15c2h32π5k4≈5.67×10⁻⁸m2⋅K4Wwhere k k k is the Boltzmann constant, c c c is the speed of light in a vacuum, and h h h is Planck's constant. The units are watts per (square meter - degree Kelvin to the fourth power), and 0 ° K = 273.15 ° C 0 \degree K = 273.15 \degree C 0°K=273.15°C.
Global Warming
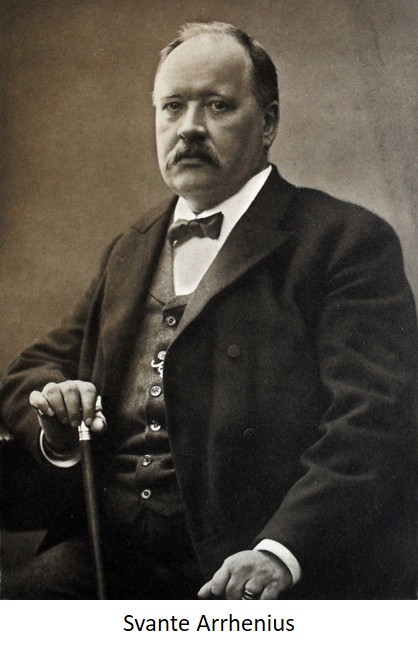
Using the works of Tyndall, Stefan, and Boltzmann, Swedish chemist Svante Arrhenius developed a relationship between global warming and C O 2 CO_2 CO2 concentration, publishing his results in the London, Edinburgh, and Dublin Philosophical Magazine and Journal of Science in 1896. He showed that doubling the concentration of carbon dioxide in the atmosphere would increase global temperatures between 5.5 ° F 5.5\degree F 5.5°F and 9 ° F 9\degree F 9°F.
What does the Stefan-Boltzmann law mean? An object at temperature T T T in degrees Kelvin radiates energy j ∗ j^* j∗ in Watts per square meter. Watts are a unit of power, but multiply power by time to get energy. Also, the Stefan-Boltzmann law applies to blackbody radiators or perfect radiators, but most objects are not quite ideal, so emit less energy than a blackbody.
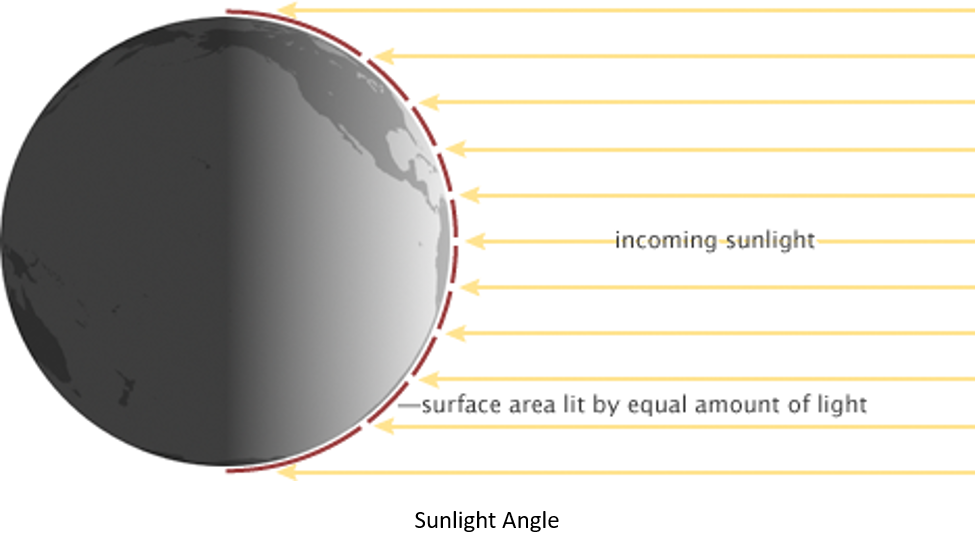
Conversely, for an object to radiate more energy, it needs to be hotter, and this is how the law applies to climate science. Sunlight is mostly in the visible spectrum (380 nm - 700 nm) which is transparent to atmospheric molecules. After the light reaches the surface it warms the earth. To maintain an energy balance an equivalent amount needs to be reradiated into space.
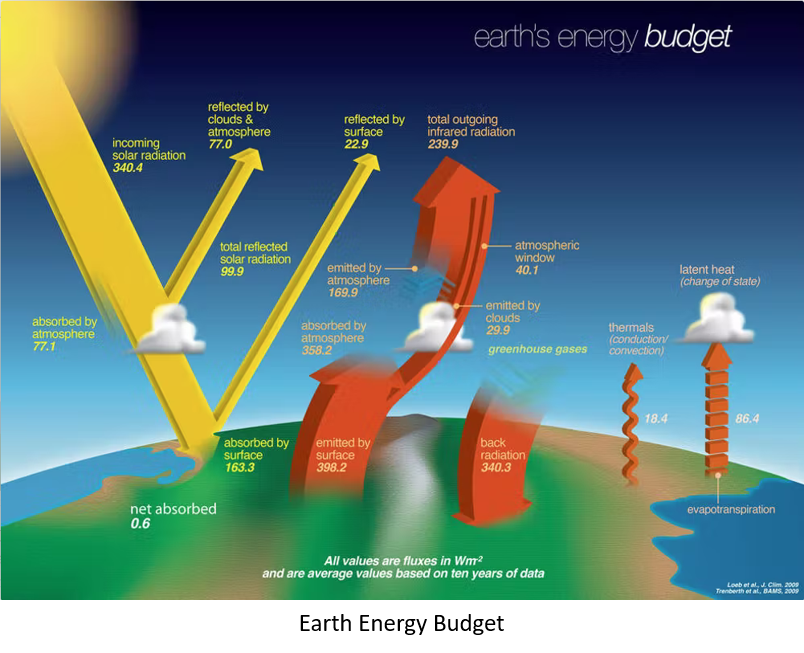
The top of the atmosphere receives around 1370 W m 2 1370 \frac{W}{m^2} 1370m2W from the sun. About 30% is reflected by clouds and other atmospheric molecules, leaving approximately 1000 W m 2 1000 \; \frac{W}{m^2} 1000m2W at the Earth's surface. Due to the curvature of the Earth, and since only one side is illuminated, this reduces to an average of 340.4 W m 2 340.4 \frac{W}{m^2} 340.4m2W.
Reradiation from the warmed surface is in the infrared spectrum
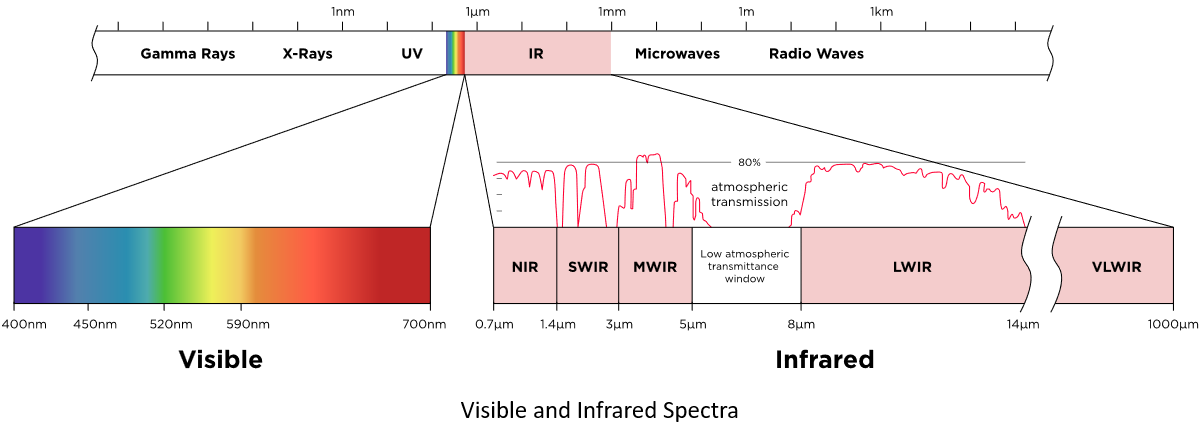
which is where the trouble begins. Divalent molecules or molecules with a single central atom bonded to two other atoms are often excellent absorbers of infrared radiation.
Examples of divalent molecules are H 2 O , C O 2 H_2 O, \; CO_2 H2O,CO2, and N O 2 NO_2 NO2, but an even better heat-trapping molecule, with one central atom and four bonds, is methane, C H 4 CH_4 CH4. You might think of these molecules as tiny tuning forks resonating at the infrared (IR) frequency when struck by outgoing radiation.
Since the molecules don't know which way is up, they reradiate the absorbed IR in all directions. Half of the energy returns to Earth, so we wind up with an imbalance (see the back radiation of 340.3 W m 2 340.3 \frac{W}{m^2} 340.3m2W in the figure above). To get rid of the extra energy, the Stefan-Boltzmann law says the Earth has to heat up.
Using the Stefan-Boltzmann Law, we can calculate the temperature of the surface of the Earth. Since T = ( j ∗ σ ) 1 / 4 T = \left( \frac{j^*}{\sigma} \right)^{1/4} T=(σj∗)1/4,
T Earth = ( 340.3 W m 2 5.67 × 1 0 − 8 W m 2 − ° K ) 1 / 4 = 278.3567 ° K . T_{\text{Earth}} = \left( \frac{340.3 \frac{W}{m^2}}{5.67 \times 10^{-8} \frac{W}{m^2-\degree K}} \right)^{1/4} = 278.3567 \degree K. TEarth=(5.67×10⁻⁸m2−°KW340.3m2W)1/4=278.3567°K.The actual temperature is about 288 ° K 288 \degree K 288°K, and the difference is due to the heat trapping capability of greenhouse gases. Without them, the Earth would be too cold to support life as we know it.
Arithmetic, Population, and Energy
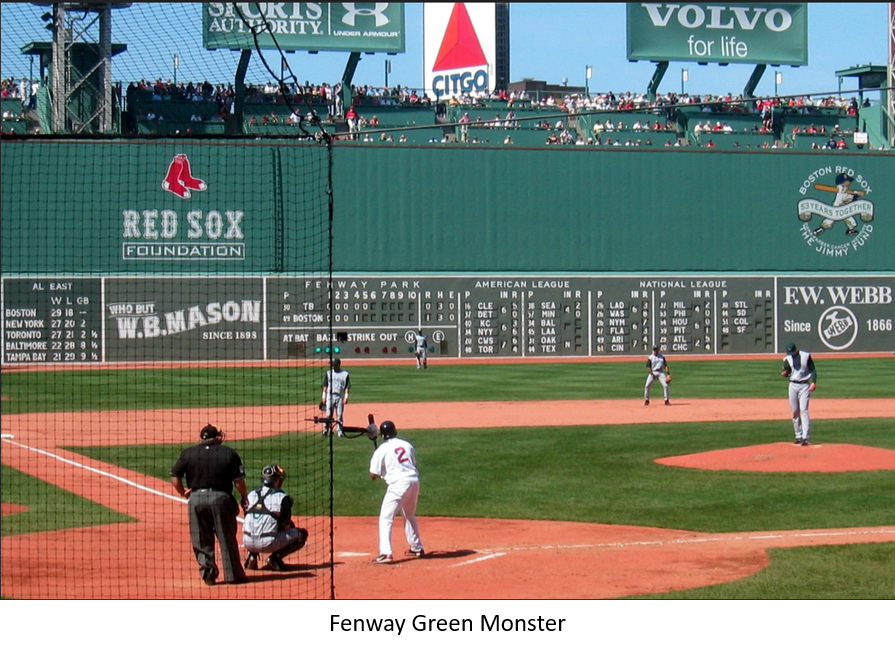
Fenway Park in Boston, MA is home to the Boston Red Sox. The stadium was built in 1912, rebuilt in 1934, and is the oldest MLB stadium still in use. According to the Bleacher Report, "The park has the shortest distance of any field in baseball to left-field (310 feet) or right-field (302 feet)."
The left-field wall, called the "Green Monster", is 37 feet tall and houses the scoreboard. The scores are updated manually, and if a batter hits a ball through a hole where a number is being updated, it's an automatic ground-rule double.
Snidely Whiplash forced you at epee point to the upper bleachers just below the Citgo sign. There, he chained you to the seats, locked with an old-fashioned padlock. What is he up to? What have you ever done to Snidely? Nothing. He's just evil. As you watch, he wanders all around the bleachers applying Whiplash's Wicked Waterproofing to the entire interior of Fenway.
After a while, he makes his way out onto the empty field, still deploying his wicked waterproofing concoction. The grounds crew will have a real mess to clean up. Standing on the pitcher's mound, he yells up to you, "You're doomed now!," and removes his patented Snidely's Sneaky Pipette from his pocket.
"I'm going to drip one drop, then a second later two drops, then four, and so on until you drown", yells Snidely.
Drip.
Drip, drip.
Drip, drip, drip, drip.
Really, Snidely? At this rate, those drips will evaporate long before there's a problem. You can leisurely figure out how to pick the padlock and saunter off while Snidely is still dripping his stupid drips. Since you have plenty of time, why not figure out just how long it will take Whiplash to fill Fenway?
You didn't bring your slide rule so you'll have to estimate another way. Recalling the dimensions from home plate to the right and left walls are about 300 feet, then the area of the field is ( 3 × 1 0 2 ) 2 = 9 × 1 0 4 ≈ 1 0 5 (3 \times 10^2)^2 = 9 \times 10^4 \approx 10^5 (3×10²)2=9×10⁴≈105 square feet. Every 10 feet of depth is a million cubic feet of volume.
Since the Green Monster is 37 feet tall, you might be 50 feet above the field and the actual area of the stands is probably double the area of the field, so let's multiply the volume estimate by 100 to get 1 0 5 × 1 0 2 = 1 0 7 10^5 \times 10^2 = 10^7 105×102=107 or 10 million cubic feet.
How many drops of water are there in a cubic foot? Picture lining up drips along a ruler. You estimate about 100 drops to fit a foot long ruler, so in a cubic foot there would be ( 1 0 2 ) 3 = 1 0 6 (10^2)^3 = 10^6 (102)3=106 or a million drops per cubic foot. (The accepted number is 566,336.93, but we're rounding.)
To completely fill Fenway, Whiplash will have to drip 1 0 6 × 1 0 7 = 1 0 13 10^6 \times 10^7 = 10^{13} 106×107=1013 drops. Plenty of time. Let's work out some powers of 2 since he's doubling the number of drops every second.
You might remember that 2 10 = 1024 2^{10} = 1024 210=1024, but if not, start with 2 and keep doubling until you get there: 2 , 4 , 8 , 16 , 32 , 64 , 128 , 256 , 512 , 1024 2,4,8,16,32,64,128,256,512,1024 2,4,8,16,32,64,128,256,512,1024.
Ten seconds after the first drop, Snidely will drip out about 1000 drops, not even enough to get one square foot damp. Hardly worth worrying about. After 20 seconds, it will be 2 20 = 2 10 × 2 10 = 1 , 000 , 000 = 1 0 6 2^{20} = 2^{10} \times 2^{10} = 1,000,000 = 10^6 220=210×210=1,000,000=106 or a million drops. Double the time again, and we're up to 1 0 12 10^{12} 1012 drops Snidely is pouring out onto the field. If you sum the totals, you'll find
∑ k = 0 n 2 k = 1 + 2 + 4 + … + 2 n = 2 n + 1 − 1. \sum_{k=0}^n 2^k = 1 + 2 + 4 + \ldots + 2^n = 2^{n+1} - 1. k=0∑n2k=1+2+4+…+2n=2n+1−1.In other words, you've got about 40 seconds to pick the padlock and leap to safety over the left-field wall! And you've already wasted 39 1 / 2 39 \; 1/2 391/2 of them on these idiotic math calculations!
Albert Bartlett taught nuclear physics at the University of Colorado at Boulder. He gave a very popular lecture, Arithmetic, Population and Energy (1,742 times!), always beginning with
The greatest shortcoming of the human race is our inability to understand the exponential function.
Meltdown!
Since economic growth depends on increasing energy inputs, and all of the energy eventually is converted to waste heat, we can calculate the temperature of the Earth as a function of exponential growth.
In 2019, the World consumed 160,000 TWh of energy ( 1 T W h = 1 0 12 watt-hours ) (1 \; TWh = 10^{12} \; \text{watt-hours}) (1TWh=1012watt-hours). The surface area of the Earth is about 5 × 1 0 8 k m 2 = 5 × 1 0 14 m 2 5 \times 10^8 \; km^2 = 5 \times 10^{14} \; m^2 5×10⁸km2=5×10¹⁴m2, and there are 365 × 24 = 8760 365 \times 24 = 8760 365×24=8760 hours in a year. Divide total energy consumed by the number of hours in a year to get the average power
P = 1.6 × 1 0 17 W h 8760 h ≈ 2 × 1 0 13 W . P = \frac{1.6 \times 10^{17} \; Wh}{8760 \; h} \approx 2 \times 10^{13} \; W. P=8760h1.6×1017Wh≈2×10¹³W.Now, divide the power by the surface area to get watts per square meter, 0.04 W m 2 0.04 \frac{W}{m^2} 0.04m2W. Let's recalculate the temperature of the Earth with this extra energy,
T Earth = ( ( 340.3 + 0.04 ) W m 2 5.67 × 1 0 − 8 W m 2 − ° K ) 1 / 4 = 278.3648 ° K . T_{\text{Earth}} = \left( \frac{(340.3 + 0.04) \frac{W}{m^2}}{5.67 \times 10^{-8} \frac{W}{m^2-\degree K}} \right)^{1/4} = 278.3648 \degree K. TEarth=(5.67×10⁻⁸m2−°KW(340.3+0.04)m2W)1/4=278.3648°K.All of our energy consuming has raised the temperature by 0.0081 ° 0.0081 \degree 0.0081°. Nothing to worry about here. Suppose your bank account paid just a bit more than 2%, say 2 1 3 2 \frac{1}{3} 231%. The extra 1 3 \frac{1}{3} 31% is just enough so that over a century, the value of your account will grow by a factor of 10.
If the economy also grew by a factor of 10 in a century, then the temperature of the Earth would be (ignoring greenhouse gases)
T Earth = ( ( 340.3 + 0.4 ) W m 2 5.67 × 1 0 − 8 W m 2 − ° K ) 1 / 4 = 278.4384 ° K . T_{\text{Earth}} = \left( \frac{(340.3 + 0.4) \frac{W}{m^2}}{5.67 \times 10^{-8} \frac{W}{m^2-\degree K}} \right)^{1/4} = 278.4384 \degree K. TEarth=(5.67×10⁻⁸m2−°KW(340.3+0.4)m2W)1/4=278.4384°K.

After another hundred years, the economy adds 4 4 4 Watts per square meter. A century later it's up to 40 W m 2 40 \; \frac{W}{m^2} 40m2W, and pretty soon you've got a Snidely Whiplash kind of problem.
The formula for the Earth's temperature is
T Earth = ( ( 340.3 + ( 1 + r 100 ) t ) W m 2 5.67 × 1 0 − 8 W m 2 − ° K ) 1 / 4 T_{\text{Earth}} = \left( \frac{(340.3 + (1+\frac{r}{100})^t) \frac{W}{m^2}}{5.67 \times 10^{-8} \frac{W}{m^2-\degree K}} \right)^{1/4} TEarth=(5.67×10⁻⁸m2−°KW(340.3+(1+100r)t)m2W)1/4where r r r is the annual growth rate of the economy in percent, and t t t is the number of years. This shows the effect on the Earth's surface temperature with a constant economic growth rate of 2.3 % 2.3 \% 2.3%:
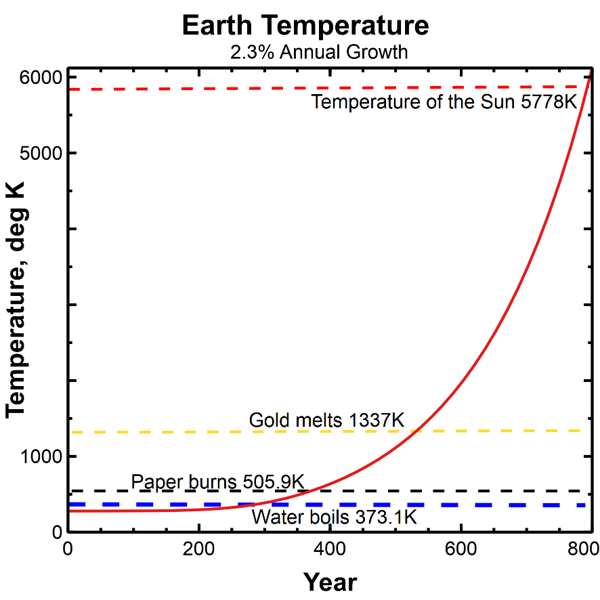
Water boils after 292 years, paper burns at year 357, gold melts in year 533, and after 789 years of constant growth, the surface of the Earth is the same temperature as the Sun.
It can be difficult to imagine events taking place hundreds of years into the future, so a better way to think about this is to recall events in history. If 2.3% continuous economic growth had begun in the years 1730, 1665, 1489, or 1233 we'd be experiencing the effects now.
| Year | Event | Temperature | Comment |
|---|---|---|---|
| 1730 | Baltimore, MD founded, Fredrick the Great becomes King of Prussia (1740) | 373.1 | Water boils |
| 1665 | Vermeer paints Girl with a Pearl Earring, Great Fire of London (1666) | 505.9 | Paper burns |
| 1489 | The Queen of Cyprus, Catherine Cornaro, sells her kingdom to the Republic of Venice (March 14) | 1337 | Gold melts |
| 1233 | Catholic Inquisition begins, Magna Carta (1215) | 5778 | Sun temperature |
With 2.3 % 2.3\% 2.3% growth starting in 1492, the year Columbus first arrived in the New World, gold would begin melting now.
Good News and Bad News
The good news is we don't have nearly enough energy to get temperatures to these levels. The bad news is the economy can't keep growing. The math used here applies to exponential growth, but linear growth would have the same effects over a longer time.
Some economists have proposed alternatives to growth such as Donut Economics, which requires that everyone live within the Earth's ecological ceiling, regenerating and recycling all materials.
Branko Milanović, an economist at CUNY's Stone Center on Socio-Economic Inequality says for donut economics to take hold, people would have to "magically" become "indifferent to how well we do compared to others, and not really care about wealth and income."
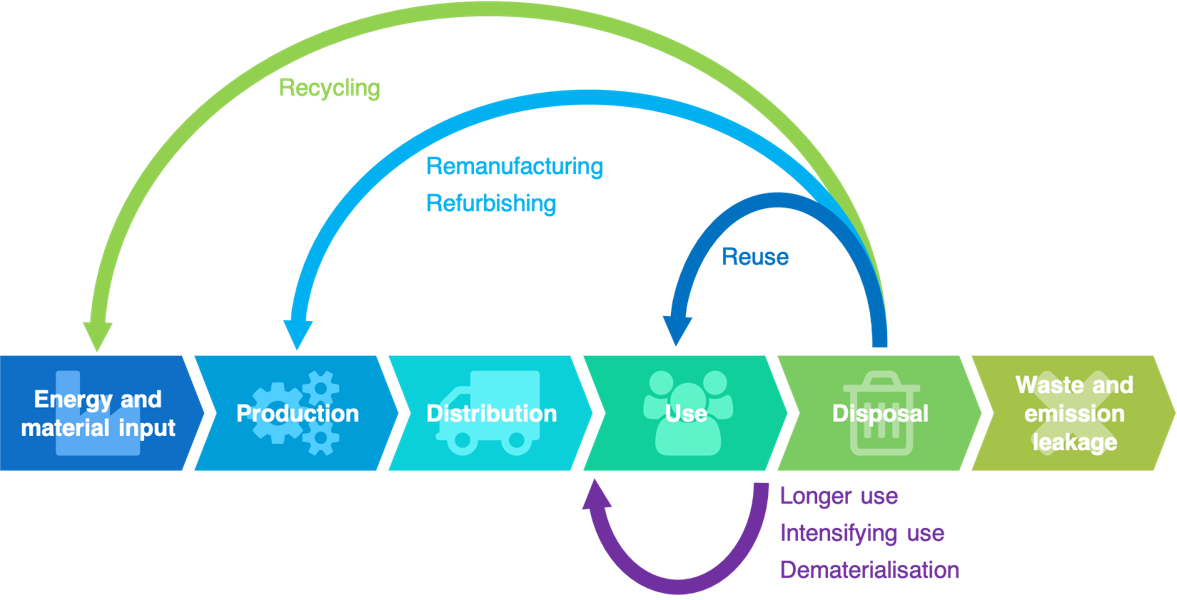
A similar proposed new economy is the Circular Economy, which involves sharing, leasing, reusing, repairing, refurbishing, and recycling existing materials and products for as long as possible. In this way, the life cycle of products could be extended.
Simon Michaux, Senior Scientist with the Geological Survey of Finland says of the circular economy
Circular Economy (CE) as a proposed solution is a good start but ultimately not a viable replacement in its current form. This is due to the CE not being able to allow for economic growth or human population growth, yet still develop a system based around recycling only. The mining of minerals is considered not relevant as it is to be phased out.
Efficiency won't help much either. Heat engines are limited by the Carnot Efficiency Limit, wind energy by the Betz Limit, and photovoltaic solar cells by the bandgap limit. Making machines more efficient moves the timeline out a few years, but the result is the same.
The End of Classical Economics
We've explored the fundamental conflict between continuous economic growth and the laws of thermodynamics, specifically the Stefan-Boltzmann Law. Economic growth requires increasing energy consumption, which ultimately converts to waste heat, and maintaining the current global economic growth rate of 2.3% would lead to catastrophic temperature increases over centuries:
- Water would boil after 292 years
- Paper would burn after 357 years
- Gold would melt after 533 years
- Earth's surface would reach the Sun's temperature ( 5778 ° K 5778 \degree K 5778°K) after 789 years
To put this in historical perspective, if this growth rate had started in 1492 when Columbus reached the Americas, gold would be melting on Earth's surface today. Perpetual economic growth is physically impossible due to thermodynamic constraints, regardless of technological efficiency improvements. Since there isn't enough energy to allow continuous economic expansion, it's clear that growth must end.
So, as John Michael Greer writes, "Collapse now, and avoid the rush".
Image credits
- Hero: The Harrowing of Hell, Hieronymus Bosch. Wikimedia Commons
- Underpants Gnomes: South Park, Season 2 E 17 • 12/16/1998
- Correlation: Randall Munroe, XKCD.
- Mafia Goon: Mafia Patty FAKE, A Hat in Time Wiki
- Eunice Foote: Eunice Newton Foote, the Forgotten Pioneer of the Greenhouse Effect. Javier Yanes, OpenMind, Mar 8, 2022 and Nucleation Capital.
- John Tyndall: Tyndall National Institute.
- Apparatus: Tyndall's setup for measuring radiant heat absorption by gases, Wikipedia.
- Jozef Stefan: Wikimedia Commons.
- Ludwig Boltzmann: Wikimedia Commons.
- Svante Arrhenius: Future Calculations. Rudy M. Baum Sr. Science History Institute Museum & Library, Jul. 18 2016.
- Earth Energy Budget: Earth’s energy budget is out of balance – here’s how that’s warming the climate. Scott Denning, The Conversation, Aug. 9 2021.
- Sunlight Angle: Incoming Sunlight. NASA Earth Observatory, Jan 14, 2009.
- Visible and Infrared Spectrum: See Beyond Human Vision. Infiniti Electro-Optics.
- Fenway Green Monster: Wally Gobetz, Fenway Park Home Plate Green Monster, Jan 3, 2018. Boston Landmarks Commission, Citgo Sign in Kenmore Square Study Report (pg. 18).
- Meltdown!: Want to save the world? Vote. SYFY, Phil Plait, May 4, 2018.
- Alfred E. Neuman: Lost in Thought - Who Said What? ("What, me worry?") Greig Roselli, Stones of Erasmus.
References and Further Reading
- Energy Ambitions on a Finite Planet, Tom Murphy. The inspiration for this article.
- Do The Math blog, Tom Murphy
- Energy: Key Charts, Hannah Ritchie, Max Roser and Pablo Rosado - Our World in Data
- World GDP, Our World in Data
- Global primary energy consumption by source, Our World in Data
- Long-run global economic growth, Tim Garrett
- Earth’s energy budget is out of balance – here’s how that’s warming the climate, Scott Denning
- Beyond Magical Thinking: Time to Get Real on Climate Change, Vaclav Smil
- Age of Scarcity Begins With $1.6 Trillion Hit to World Economy, Maeva Cousin, Tom Orlik, and Bryce Baschuk
- Arithmetic, Population and Energy, Albert Bartlett
- Forgotten Fundamentals of the Energy Crisis - overview, Albert Bartlett
- Correlation Between Temperature and Radiation, Climate Science Investigations (CSI)
- Restructuring the Circular Economy into the Resource Balanced Economy, Simon Michaux
- Surface Temperature of the Earth, Physics in a Nutshell
- The Great Simplification podcast "Physics and Planetary Ambitions", Nate Hagens and Tom Murphy
- The Great Simplification podcast "Minerals Blindness", Nate Hagens and Simon Michaux
- Reality Blind, NJ Hagens and DJ White
- The impending global collapse: will it end the obesity epidemic?, Ugo Bardi (The answer to Donut Economics?)
- The Limits to Growth, Meadows, Meadows, Randers, Behrens (pdf here)
- The Party’s Over: Oil, War, and the Fate of Industrial Society, Richard Heinberg
- Power: Limits and Prospects for Human Survival, Richard Heinberg
- GrowthBusters podcast Paul Ehrlich on The Limits to Growth
- Through the Eye of a Needle: An Eco-Heterodox Perspective on the Renewable Energy Transition, Megan Seibert, William Rees
- Rethinking the growth mantra: an exploration of the post-normal world of declining conventional fossil energy, Terrance Berg
- Cosmic View: The Universe in 40 Jumps, Kees Boeke
📬 Subscribe and stay in the loop. · Email · GitHub · Forum · Facebook
© 2020 – 2025 Jan De Wilde & John Peach