Executive Summary: The Growing Gap
The world is facing a widening disparity between expectations for renewable energy and the thermodynamic realities of oil depletion. "The Growing Gap" explores the history, production trends, and future challenges associated with oil consumption, emphasizing the limits of transitioning to alternative energy sources.
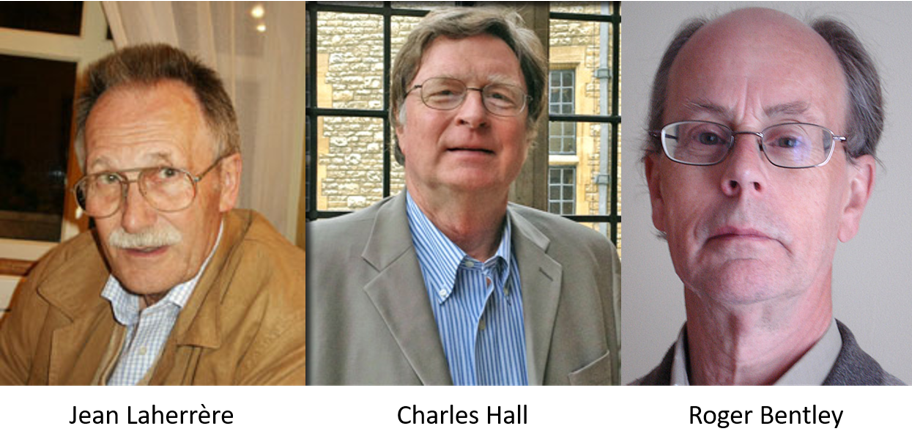
The article begins by establishing the central role of fossil fuels in modern economies, highlighting their extensive use beyond fuel—ranging from industrial processes to agriculture. It presents compelling data from experts like Jean Laherrère, Charles Hall, and Roger Bentley, demonstrating that oil discoveries have lagged behind production since the 1980s. Despite short-term gains from technologies like hydraulic fracturing, overall reserves are depleting, and extraction is becoming more energy-intensive, reducing the net energy available for society.
Key insights include:
- Peak Oil Theory: Using Hubbert’s linearization model, the article argues that global oil production must peak and decline due to finite reserves, a concept often misrepresented in mainstream economic discussions.
- Energy Return on Investment (EROI): The efficiency of energy extraction is diminishing; where early oil fields returned 50 barrels for every barrel used in production, today’s unconventional methods yield far less.
- Fracking and Extra-Heavy Oil: The U.S. fracking boom has temporarily increased output but is financially unsustainable, with steep well depletion rates and high production costs.
- Renewable Energy Challenges: While renewables are expanding, they currently lack the self-sustaining capacity to fully replace fossil fuels at current consumption levels. Issues such as resource constraints, energy storage, and supply chain dependencies pose significant hurdles.
- The Jevons Paradox: Increased efficiency in energy use may not reduce overall demand, as economic expansion tends to absorb efficiency gains, leading to greater resource consumption.
The article concludes by questioning whether a seamless transition to renewable energy is feasible, urging a critical reassessment of energy policies and assumptions about sustainability. The reality of declining oil reserves, coupled with an uncertain renewable energy future, suggests that economic and industrial models may need to adapt to a lower-energy paradigm.
The growing gap between production and discovery, between energy consumption and available resources, is a defining challenge of the coming decades—one that requires urgent attention and realistic solutions.
A recent paper by Jean Laherrère, Charles Hall, and Roger Bentley asks the question, "How much oil remains for the world to produce? Comparing assessment methods, and separating fact from fiction".
The answer depends on how much oil has been discovered, how much more we might expect to be discovered, and how much we've already used.
Laherrère is a petroleum geologist, Hall a systems ecologist, and Bentley is in the cybernetics department at the University of Reading.
Oil. What's it good for?
In an earlier article, "Economics and the Stefan Boltzmann Law", we explored how modern economies are fundamentally driven by energy. Fossil fuels—coal, natural gas, and especially oil—form the backbone of industrial civilization. Nearly every sector, from transportation and agriculture to manufacturing and medicine, depends on petroleum in some form.
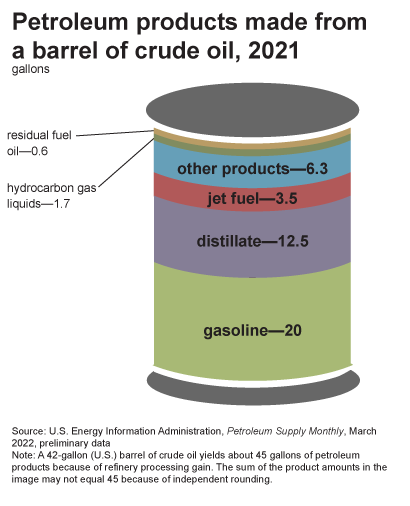
While oil is primarily associated with fuel, its derivatives extend far beyond gasoline and diesel. According to Ranken Energy, over 6,000 products are made from oil, including pharmaceuticals, synthetic fabrics, plastics, fertilizers, and even everyday household items like paint, pillows, and cosmetics. A typical 42-gallon barrel of crude oil yields about 20 gallons of gasoline, 11 gallons of diesel, and 3.5 gallons of jet fuel, with the remainder used in a wide range of industrial applications.
One of oil’s most critical uses is in agriculture—specifically, in fertilizer production. Modern industrial farming relies on ammonia-based fertilizers, which are synthesized using natural gas in the Haber-Bosch process. Developed in the early 20th century, this process revolutionized food production by enabling large-scale nitrogen fixation, drastically increasing global agricultural yields. Today, it’s estimated that half of the world's population depends on food grown with synthetic fertilizers derived from fossil fuels [Thyssenkrupp].
The process was pioneered by Fritz Haber, a German chemist who won the 1918 Nobel Prize in Chemistry for his work on ammonia synthesis. However, Haber’s legacy is complicated. During World War I, he turned his expertise to chemical warfare, overseeing the deployment of poison gas on the battlefield. His research also led to the development of Zyklon B, the gas infamously used in Nazi concentration camps—a tragic irony, as many of his own relatives perished in the Holocaust. His wife, Clara Immerwahr, a pacifist chemist, strongly opposed his involvement in chemical weapons and took her own life in protest.
Haber’s dual legacy—expanding agricultural production while advancing chemical warfare—mirrors the broader impact of fossil fuels. The Haber-Bosch process did not save millions of people, but it enabled an unprecedented population boom by making industrial-scale farming possible. This rapid expansion has come at a cost, as modern agriculture now depends on finite fossil fuel inputs. Similarly, oil has powered industrial civilization but has also locked humanity into a system of resource depletion, environmental destruction, and economic volatility. Just as the long-term consequences of synthetic fertilizers—soil degradation, nitrogen pollution, and ecosystem collapse—are becoming clear, the world must now reckon with the limits of oil and the growing gap between energy expectations and reality.
The real problem of humanity is the following: We have Paleolithic emotions, medieval institutions and godlike technology. And it is terrifically dangerous, and it is now approaching a point of crisis overall.
-- Edward O. Wilson
Peak Oil
Investopedia says of peak oil:
Peak oil refers to the hypothetical point at which global crude oil production will hit its maximum rate, after which production will start to decline. This concept is derived from geophysicist Marion King Hubbert's "peak theory," which states that oil production follows a bell-shaped curve.
Many people confuse the terms "hypothesis" and "theory". From Merriam-Webster:
Hypothesis: a tentative assumption made to draw out and test its logical or empirical consequences
Theory: a plausible or scientifically acceptable general principle or body of principles offered to explain phenomena
Accepting that the quantity of oil is finite, a maximum production rate is provable and isn't merely hypothetical.
There are at least two ways to prove that a peak in production must occur. The more complicated method is to use Rolle's Theorem:
Theorem: If a real-valued function f f f is continuous on a proper closed interval [ a , b ] [a, b] [a,b], differentiable on the open interval ( a , b ) (a, b) (a,b), and f ( a ) = f ( b ) f (a) = f (b) f (a)=f (b), then there exists at least one c c c in the open interval ( a , b ) (a, b) (a,b) such that f ′ ( c ) = 0 f' ( c ) = 0 f′(c)=0.
For oil production, f f f is the quantity produced at any moment. The interval [ a , b ] [a,b] [a,b] is the oil production era. To be a closed interval, time a a a is any point before oil production began, and point b b b will be when oil production ceases. For f f f to be differentiable on the open interval ( a , b ) (a,b) (a,b) it must be a smooth function that can be traced from point a a a to point b b b.
Since a a a and b b b are times outside the interval of oil production, then f ( a ) = f ( b ) = 0 f(a) = f(b) = 0 f(a)=f(b)=0, so the theorem says there exists at least one point c c c between a a a and b b b such that f ′ ( c ) = 0 f'(c) = 0 f′(c)=0. The derivative f ′ f' f′ is a measure of the slope of the function f f f. In the case of resources, f ( t ) ≥ 0 f(t) \geq 0 f(t)≥0, so the derivative f ′ ( c ) f'(c) f′(c) must be at a maximum for at least one value of c c c. In other words, production increases before c c c and decreases later, so c c c is a peak in production. This might happen more than once on the interval [ a , b ] [a,b] [a,b], but we can choose the maximum of all these peaks.
An easier proof is by contradiction. Assume that no peak ever happens. Then, whatever maximum occurred in the past must be exceeded sometime in the future. Later, that peak will also be exceeded, and so on, infinitely many times. Add up all of the peaks and you get an infinite amount of oil, which contradicts the assumption of a finite quantity.
Is peak oil something to be concerned about? Many people assume that society can and will transition to clean energy sources. If this assumption is incorrect, then post-peak the available energy will decline, and with it a permanent decline in the economy.
Data sources
Geologists classify oil deposits into three groupings, proven (1P), probable (2P), and possible (3P) that have a 90%, 50%, and 10% probability of commercial extraction, respectively. The classifications can change depending on the cost of oil and improvements in technology.
Another classification is based on how the oil is produced. Most oil fields are considered to be "conventional". Conventional is obtained by drilling into a reservoir where underground pressure forces oil to the surface. Offshore oil is similar but requires offshore floating platforms. Hydraulic fracturing (fracking) uses high-pressure liquids to break open sub-surface oil-bearing rock. Extra-heavy tar sands are surface mined, mainly from Athabasca in Canada and Orinoco in Venezuela.
There are several sources for data:
- Energy Information Agency (EIA)
- BP Statistical Review of World Energy, (click Download full report)
- Our World in Data
- JODI
- International Energy Agency (IEA) - subscription only
- Statista - subscription only
- Wood Mackenzie - subscription only
Discoveries
How much oil has been discovered? It's kind of a squishy number. Petroleum geologists estimate the volume of oil in a field using seismic imaging and by calculating how much oil is produced from nearby wells. If you want lots of equations for reserve estimation, the AAPI wiki provides them, but the equations may not help without an accurate assessment of the methods used.
There's an incentive to overestimate, and many believe that OPEC (Organization of Petroleum Exporting Countries) did just that in the 1980s. OPEC decided that each member nation could produce at a rate proportional to their known reserves.
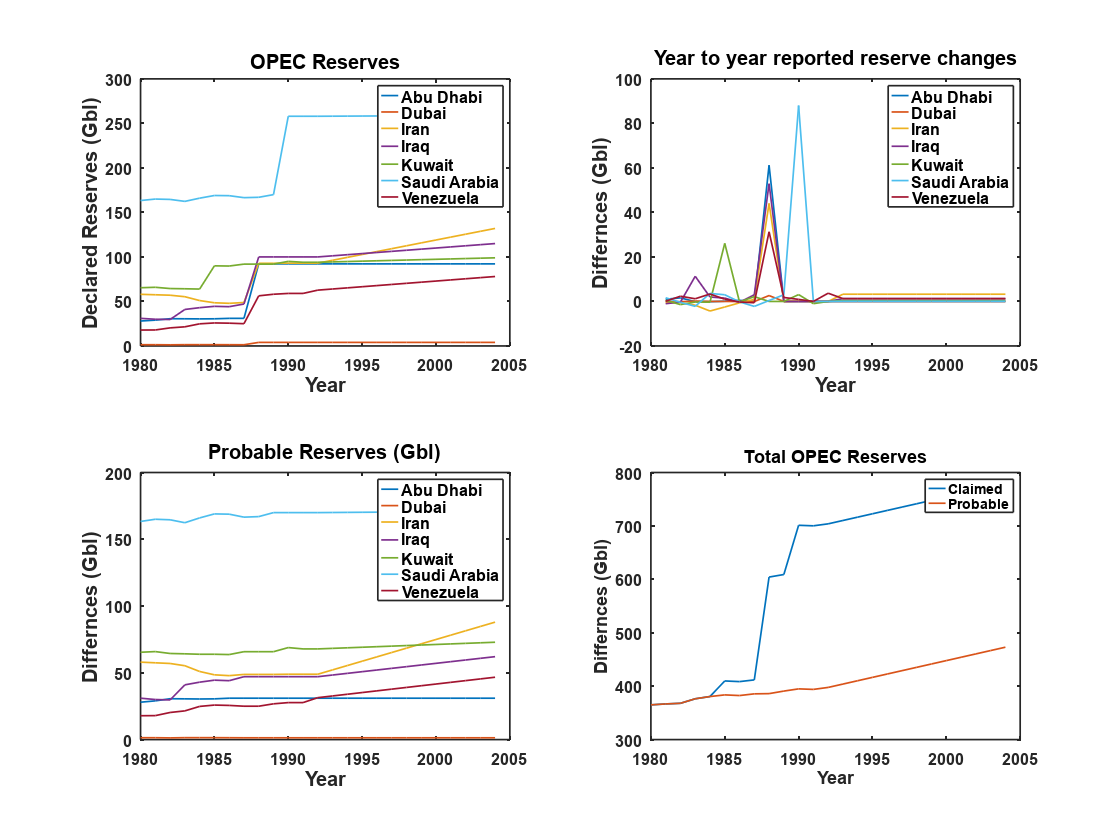
In 1988, many OPEC nations suddenly "found" a lot more oil. Saudi Arabia made their discoveries two years later. In their paper, Laherrère, Hall, and Bentley estimate that OPEC and FSU (the former Soviet Union) countries have overstated reserves by 400 Gb (1 Gb = 1 billion barrels).
Another problem with reserve estimates is that each country self-reports its reserves. Every year, the Oil and Gas Journal asks oil-producing countries for their best estimate of remaining reserves. Most countries (74 of 107 in 2021) don't bother responding, so the reserves are estimated to be the same as the previous year. In the "Declared Reserves" plot above, several countries have no change year-to-year, while others have perfectly linear increases.
The amount remaining also depends on whether the reported quantity is 1P, 2P, or 3P. Statistically, the 2P data is the most reliable because estimating 50% probability of recovery means that the oil is just as likely to be extracted as not. Laherrère et al use 2P data, and backdate estimates to the original date of discovery.
Often the first estimate of a field's size is too small, and later increases as better information becomes available. Backdating refers to adding new data to the original estimate. In fact, most "new" oil comes from increased estimates of the oil in previously discovered fields.
The 1P (90% probability of recovery) estimates are typically recorded at the time the size of the field is revised, while 2P data are backdated. Backdating 2P data gives a better estimate of the original recoverable oil in a field.
The best information comes from oil consultancy companies who sell subscriptions to their data, but even then, the results may include the reserve increases by OPEC and FSU. Subscription costs are often hundreds of thousands of dollars per year and are out of reach to everyone other than oil companies. For this reason, we'll have to rely on data from other sources, and here we'll use the Laherrère paper.
Production
Production data is more reliable than discoveries. Oil needs to be extracted from a reservoir, shipped to a refinery, refined into various products, and then sold on the wholesale market. Each step provides information on total production.
At times, sanctions have been applied to oil-producing countries curb sales and cut off money supplies. It's generally thought that total production doesn't change much under sanctions. Consuming countries that don't abide by the sanctions purchase crude or refined oil products from the sanctioned country. Oil tanker captains have been known to turn off transponders to avoid tracking.
While production data isn't perfect, it's much better than discovery data.
A look at the data
Using the data from the paper, we can get some insight, assuming the caveats outlined above, including the adjustments made by Laherrère, Hall, and Bentley to correct the reserve overestimates by OPEC and FSU. Discovery data came from IHS International, considered one of the better sources for petroleum data. Production data came from EIA.
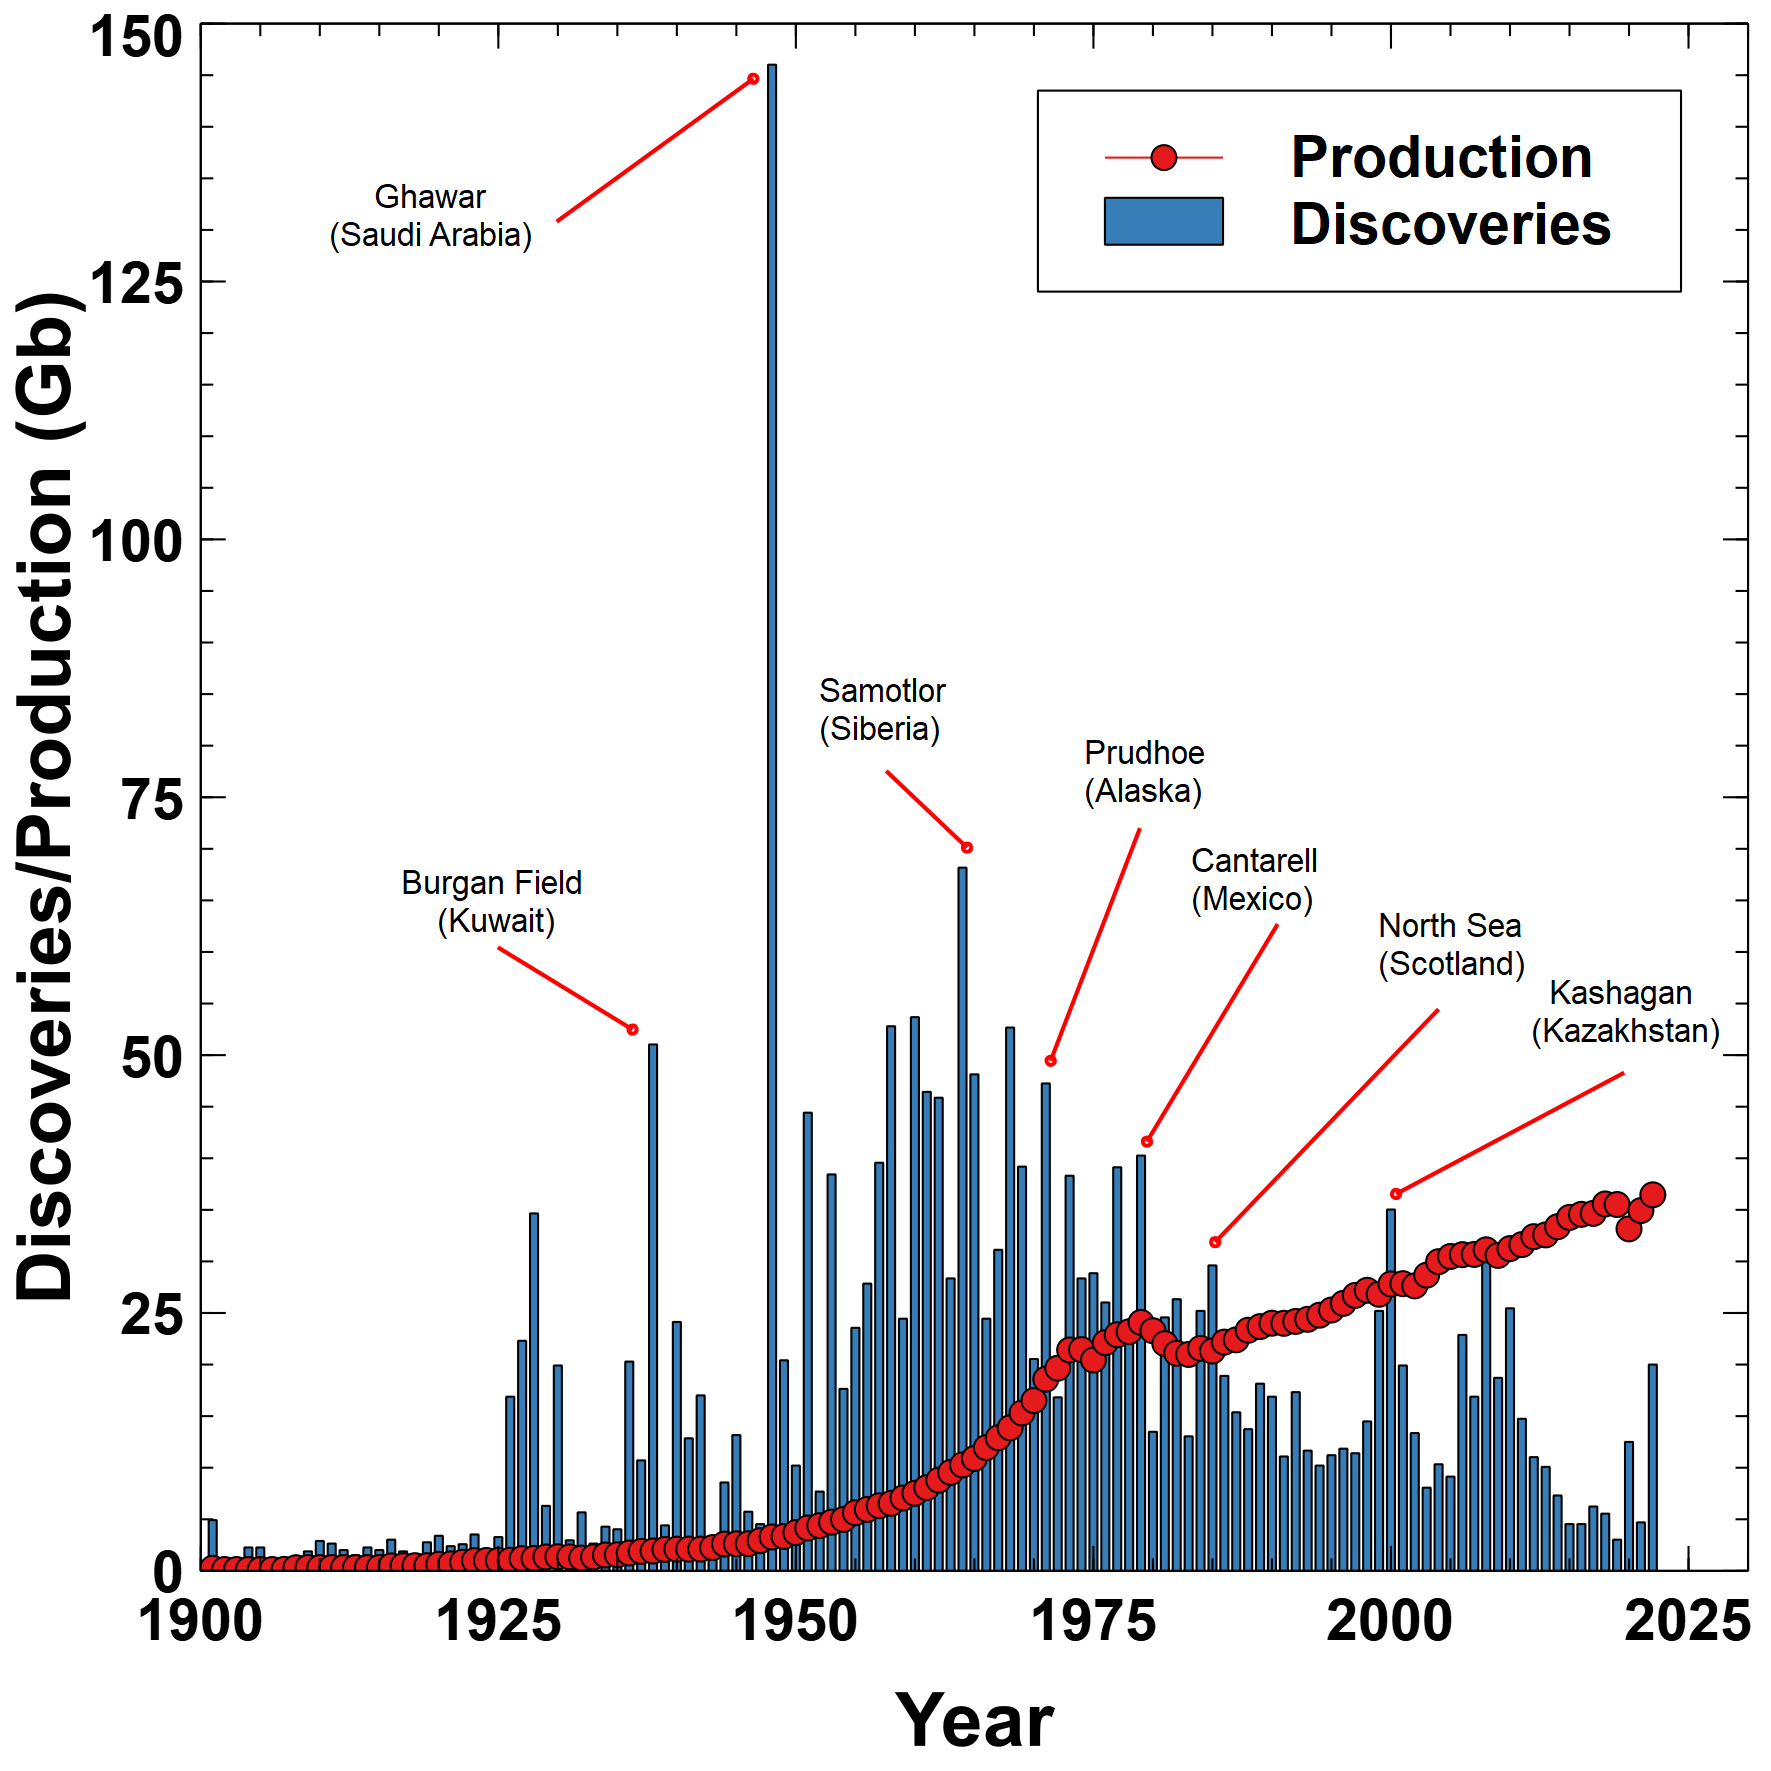
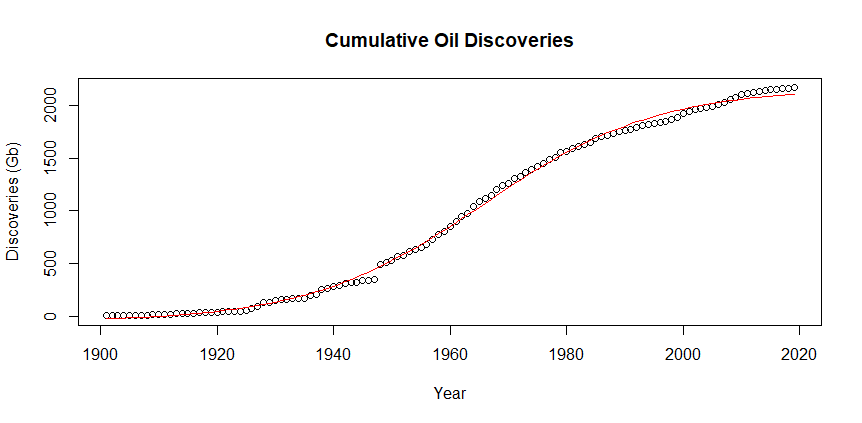
Plotting 2P backdated discovery data and production data together shows that after the North Sea discovery, only three years have had discoveries greater than production. If you think of discoveries as "putting money in the bank", then since 1983 we've been outspending our income.
Except for the giant oil field of Ghawar found in 1948, the peak of discoveries came in 1964 with Samotlor in Siberia. The size of newly found fields has been generally trending down for the last 60 years.
Cumulative discoveries and production show the trends more clearly.
Total discoveries is 2167 Gb and the total production as of 2020 is 1380 Gb. Annual production is about 30 Gb, and the difference between discoveries and production is 786 Gb, which would leave 26 years at current rates.
The midpoint of production happened in 1992, so half of all oil consumed occurred in the last 28 years. The maximum difference between discoveries and production was 1183 Gb in 1985.
Oil is a finite resource, but we've been outstripping the rate of discoveries for 40 years. The difference between production and discoveries is a rapidly growing gap.
Hubbert linearization
In 1956, M King Hubbert a geologist working for Shell Oil developed a model to estimated the total reserves based on the annual and cumulative production to date. The formula is based on the logistic function
P = ω Q ( 1 − Q Q ∞ ) P = \omega Q \left( 1 - \frac{Q}{Q_{\infty}} \right) P=ωQ(1−Q∞Q)where
- P = P = P= current production rate (Gb/yr)
- Q = Q= Q= cumulative production (Gb)
- Q ∞ = Q_{\infty}= Q∞= total producible reserves (Gb)
- ω = \omega= ω= decay proportionality constant
Early in the production of a field, Q Q Q is much smaller than Q ∞ Q_\infty Q∞ so P ≈ ω Q P \approx \omega Q P≈ωQ. At the end of the field life, Q ≈ Q ∞ Q \approx Q_\infty Q≈Q∞ so the term in parentheses becomes zero, and production ends.
The idea behind this function is that initially, oil is easy to produce, and production ramps up exponentially. Production levels off at the midpoint and then drops off to form a "bell-shaped" curve.
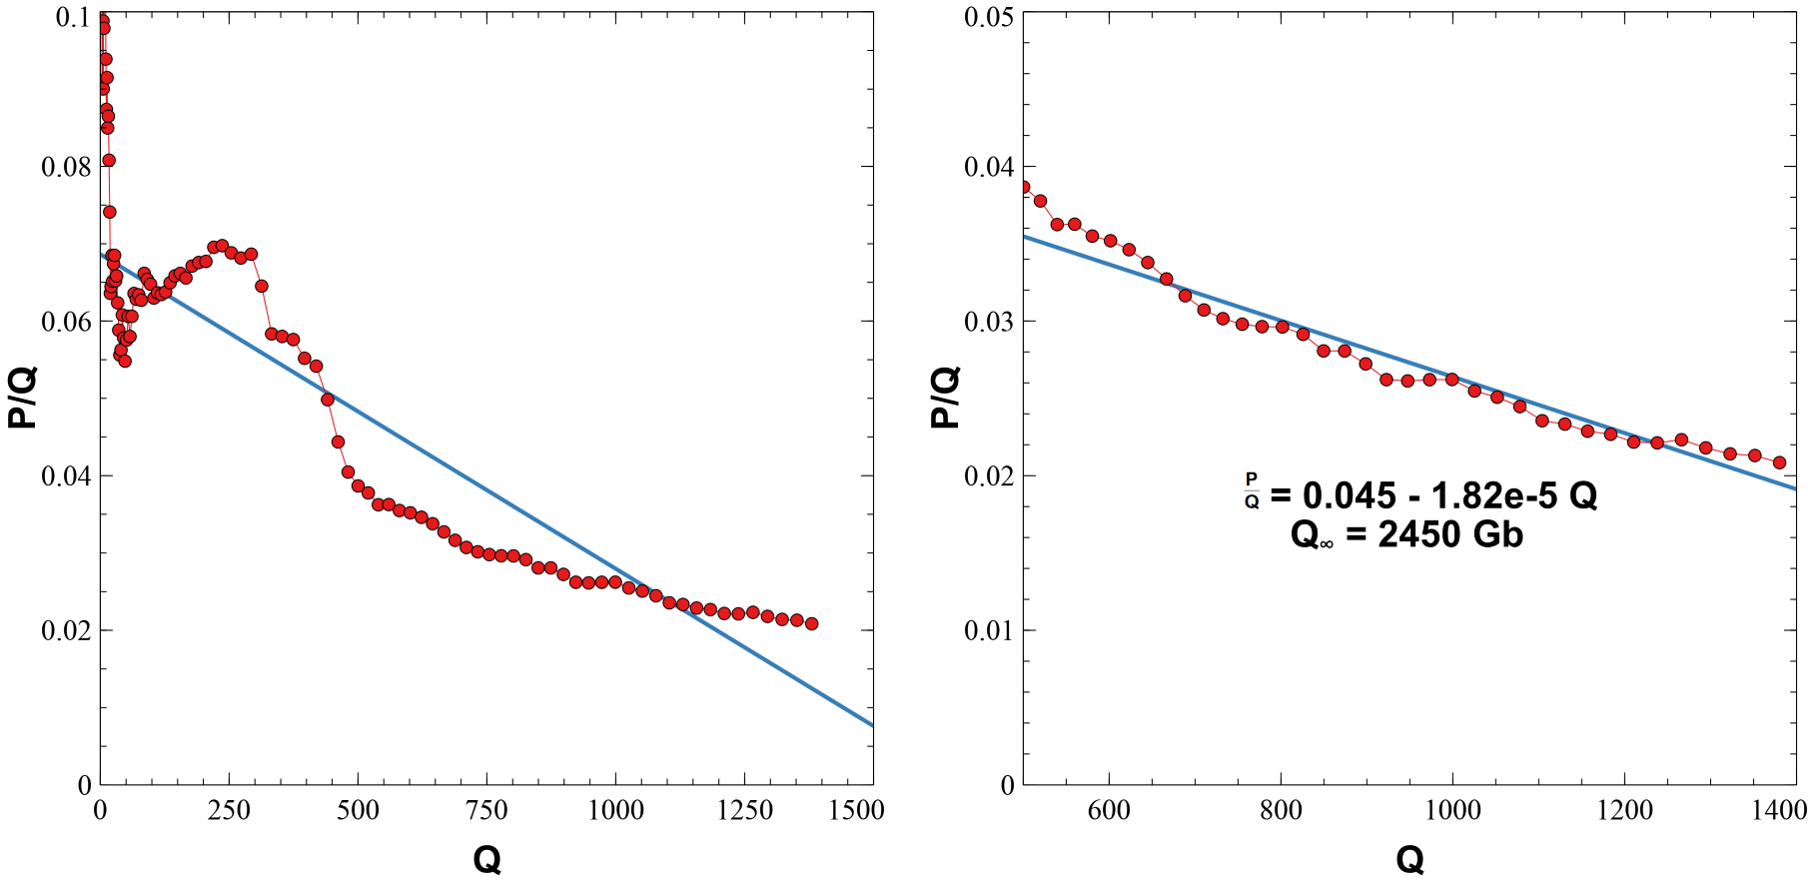
If you divide current production by the cumulative production the equation becomes
P Q = ω ( 1 − Q Q ∞ ) = − ω Q ∞ Q + ω \frac{P}{Q} = \omega \left( 1 - \frac{Q}{Q_{\infty}} \right) = -\frac{\omega}{Q_\infty}Q + \omega QP=ω(1−Q∞Q)=−Q∞ωQ+ωwhich is a linear function in Q Q Q, with slope − ω Q ∞ -\frac{\omega}{Q_\infty} −Q∞ω and y − y- y−intercept ω \omega ω. The plot of P Q \frac{P}{Q} QP against Q Q Q looks like this:
The plot on the left fits all the data, but up to about 500 Gb of cumulative production the ratio is noisy. It jumps up and down and is hard to fit. The plot on the right starts at 500 Gb and gives a much better fit.
But, there are still problems with the better fit. It's not quite linear, and seems to curve upwards at the ends. In their paper, Hubbert Math Jon Claerbout and Francis Muir say, "In real life there is no reason for the decay rate to match the growth rate". The bell-shaped curve could be skewed to one side or the other, and the linearity of the fit wouldn't hold.
Fitting discovery data
Hubbert linearization attempts to find the total of available oil resources by looking at production data. Production data is more reliable than discovery data, but if the model is flawed then data quality is immaterial.
Suppose the 2P backdated, corrected data in Laherrère, Hall, and Bentley is the best estimate for discoveries, and the logistic function represents how discoveries happen. Early in the oil age, few people were looking for oil, and seismic technology didn't exist. By the 1960s the technology had progressed to the point that oil companies regularly found large fields, but now most big oil fields have been discovered leaving only smaller fields.
The plot of discoveries above fits fairly well, although it's skewed somewhat to the right. The logistic function used to fit the data is
f ( x ; Q ∞ , k , m , C ) = Q ∞ 1 + exp ( − k ( x − m ) ) + C f(x;Q_\infty,k,m,C)= \frac{Q_\infty}{1 + \exp(-k(x-m))}+C f(x;Q∞,k,m,C)=1+exp(−k(x−m))Q∞+Cwhere
- x = x= x= cumulative discoveries, Gb
- Q ∞ = Q_\infty= Q∞= total producible reserves (Gb)
- k = k= k= logistic function growth rate
- m = m= m= midpoint of discoveries
- C = C= C= offset adjustment
The red curve is the fit to the data:
There's a big jump in 1948 with the discovery of Ghawar, and the 2 1 s t 21^{st} 21st-century data doesn't quite match, but otherwise, it's not too bad.
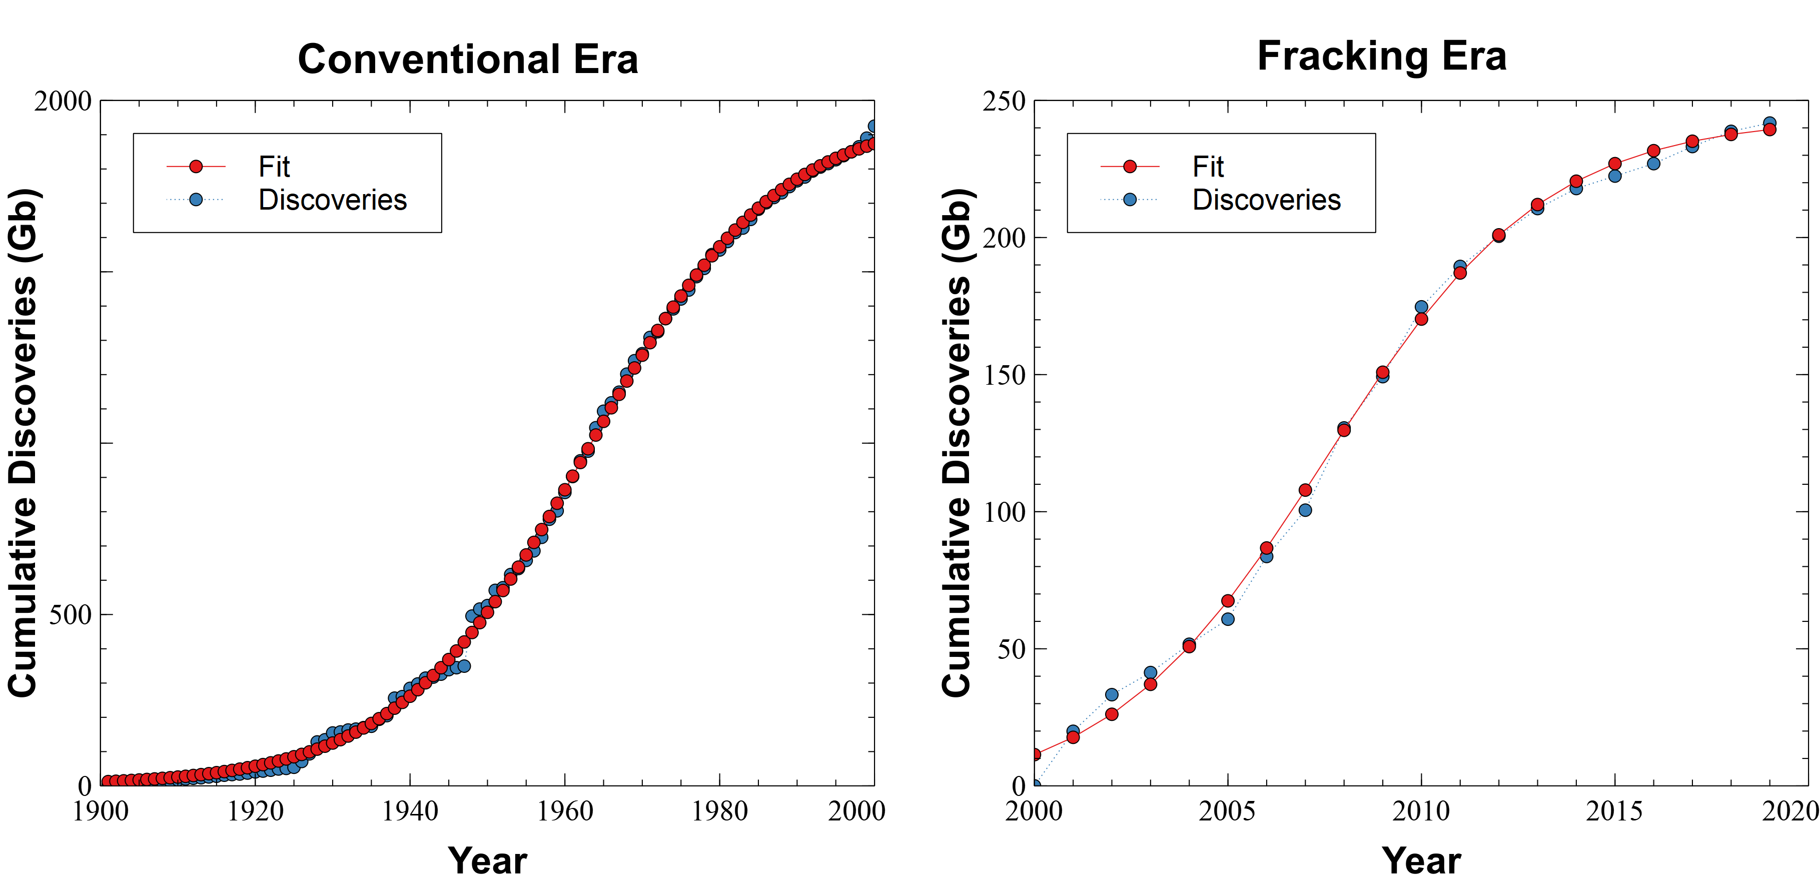
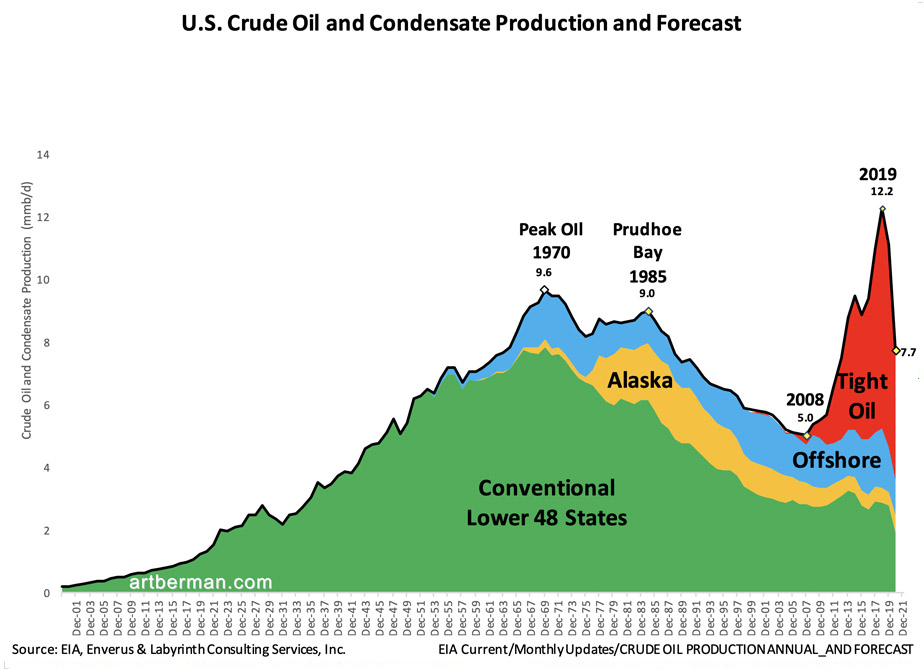
Beginning around 2005, conventional oil production reached a plateau and almost all of the additional growth in oil production came from U.S. fracking and Canadian tar sands.
Let's fit the two periods separately. The 2 0 t h 20^{th} 20th-century could be considered the time of "conventional" oil, while the "fracking era" might have started in 2000.
Splitting the data into two eras gives a very good fit and provides a direct method for Q ∞ Q_\infty Q∞ for each era. Q ∞ ( c o n v ) = 1990 Q_\infty(conv) = 1990 Q∞(conv)=1990 Gb and Q ∞ ( f r a c ) = 250 Q_\infty(frac) = 250 Q∞(frac)=250 Gb for a total of 2240 2240 2240 Gb, or about 200 200 200 Gb less than the Hubbert Linearization method.
Notice in both plots that the current cumulative discovery is very close to the predicted maximum meaning that we shouldn't expect much more.
Fitting production data
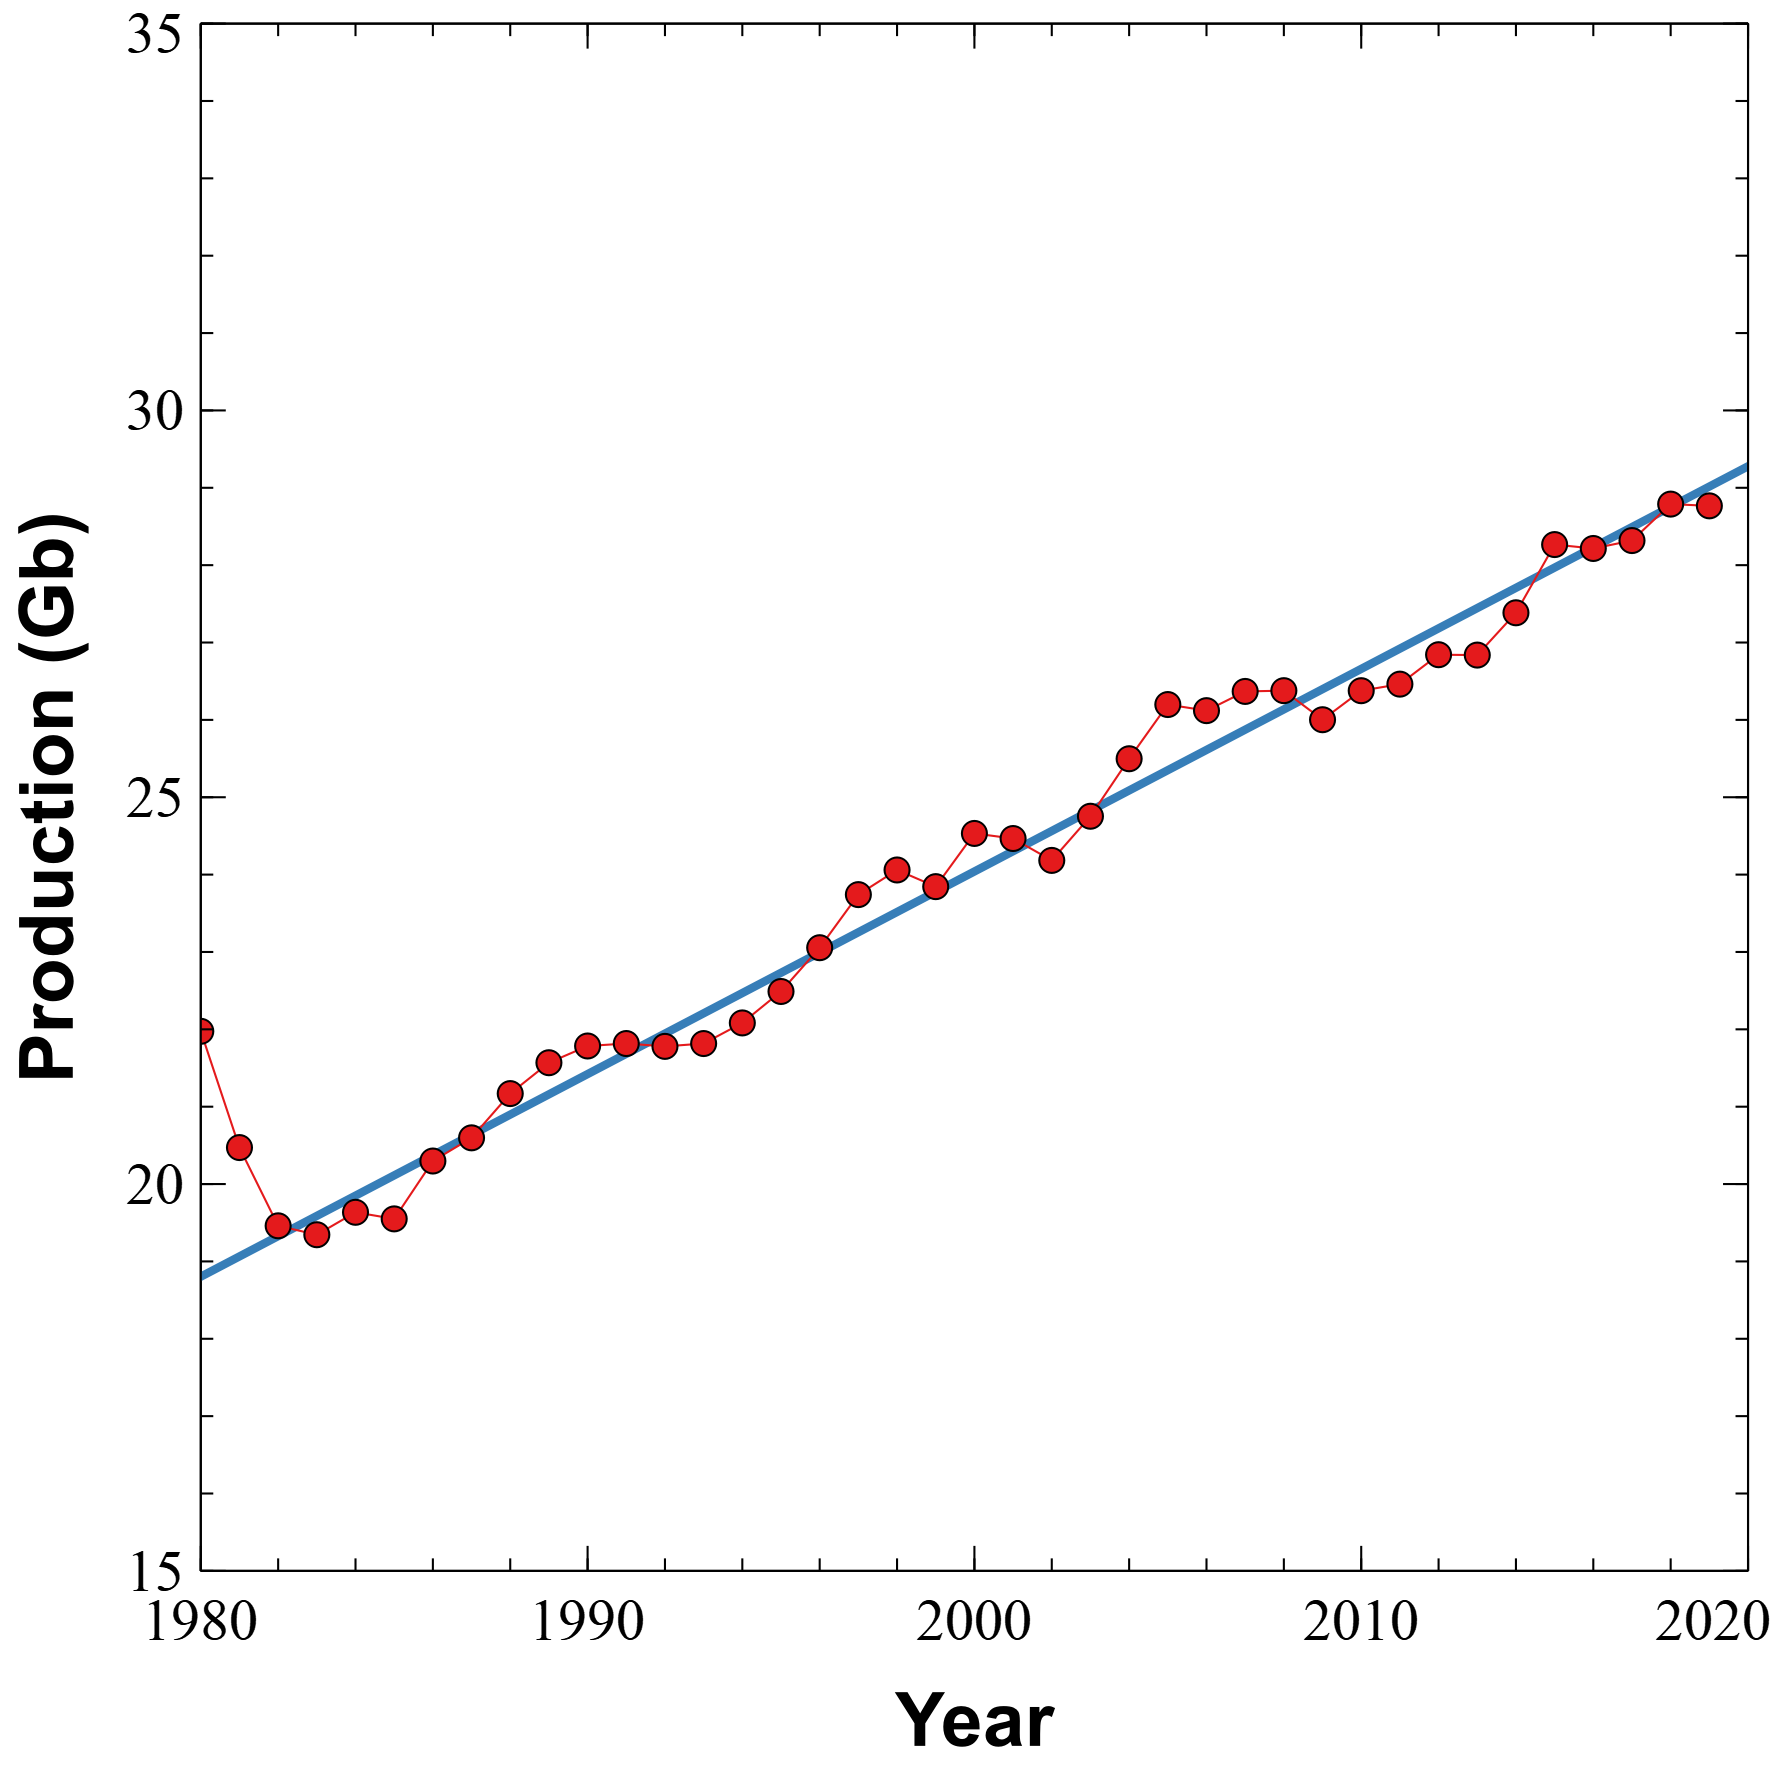
Between 1900 and 1970 oil production grew exponentially, but in the 1970s the Arab Oil Embargoes forced importing countries to become less profligate with energy and more efficient. Since about 1982, oil production has grown linearly by 0.26 0.26 0.26 Gb per year.
Using 1980 as the base year, the linear fit to production data is
P ( t ) = 0.262 t + 18.8 G b . P(t) = 0.262 t + 18.8 \; Gb. P(t)=0.262t+18.8Gb.Cumulative production is the integral of this function
C ( t ) = 0.131 t 2 + 18.8 t + k . C(t) = 0.131t^2+18.8t+k. C(t)=0.131t2+18.8t+k.The k k k is a constant of integration that makes the cumulative total be 1380 1380 1380 Gb in 2019,
C ( t ) = 0.131 t 2 + 18.8 t + k k = 1380 − 0.131 × 4 9 2 − 18.8 × 49 = 144.27 C ( t ) = 0.131 t 2 + 18.8 t + 144.27 \begin{aligned} C(t) &= 0.131 t^2 + 18.8 t+k \\ k &= 1380 - 0.131 \times 49^2 - 18.8 \times 49 = 144.27\\ C(t) &= 0.131 t^2 + 18.8 t + 144.27 \end{aligned} C(t)kC(t)=0.131t2+18.8t+k=1380−0.131×492−18.8×49=144.27=0.131t2+18.8t+144.27Using the estimate of 2240 2240 2240 Gb for the upper limit of discoveries we can calculate the time (in years since 1980) when cumulative production will equal the total of discoveries.
2240 = C ( t ) = 0.131 t 2 + 18.8 t + 144.27 0 = 0.131 t 2 + 18.8 t − 2095.73 \begin{aligned} 2240 &= C(t) = 0.131t^2 + 18.8t + 144.27\\ 0 &= 0.131t^2 + 18.8t - 2095.73 \\ \end{aligned} 22400=C(t)=0.131t2+18.8t+144.27=0.131t2+18.8t−2095.73The roots of this quadratic equation are − 217.17520 -217.17520 −217.17520 and 73.66375 73.66375 73.66375. Discarding the negative root, the world will completely run out of oil in 73.66375 73.66375 73.66375 years since 1980, or in 2053 (Saturday, Aug 30 at 6:27 AM, UTC - just kidding, it's not going to happen precisely then) unless the trajectory of discoveries or production changes.
EROI
Charles Hall (the second author of the paper) was a professor at the SUNY College of Environmental Science and Forestry. Ecologists know animals must expend some energy to stay alive. Some need to find the right plants to eat, others are predators and need to chase their prey. In either case, they expend energy searching for food.
Hall realized that the same is true for every form of energy that humans use as well. We use energy to drill the well, transport the crude petroleum to the refinery, and send the refined oil and other products to the point of sale.
The ratio of the energy derived at the final use point divided by the energy required to extract, transport, and process the oil is known as the Energy Return On Investment (EROI).
Early in the oil age, the Edwin Drake drilled a hole near Titusville, PA that progressed at a rate of 3 feet per day. Quite a bit of energy must have been expended before reaching recoverable oil.
The techniques improved, and soon, for every one barrel of oil needed to drill and transport to the refinery, a hundred barrels were recovered. Through most of the 20th century, the ratio remained at about 50 to 1.
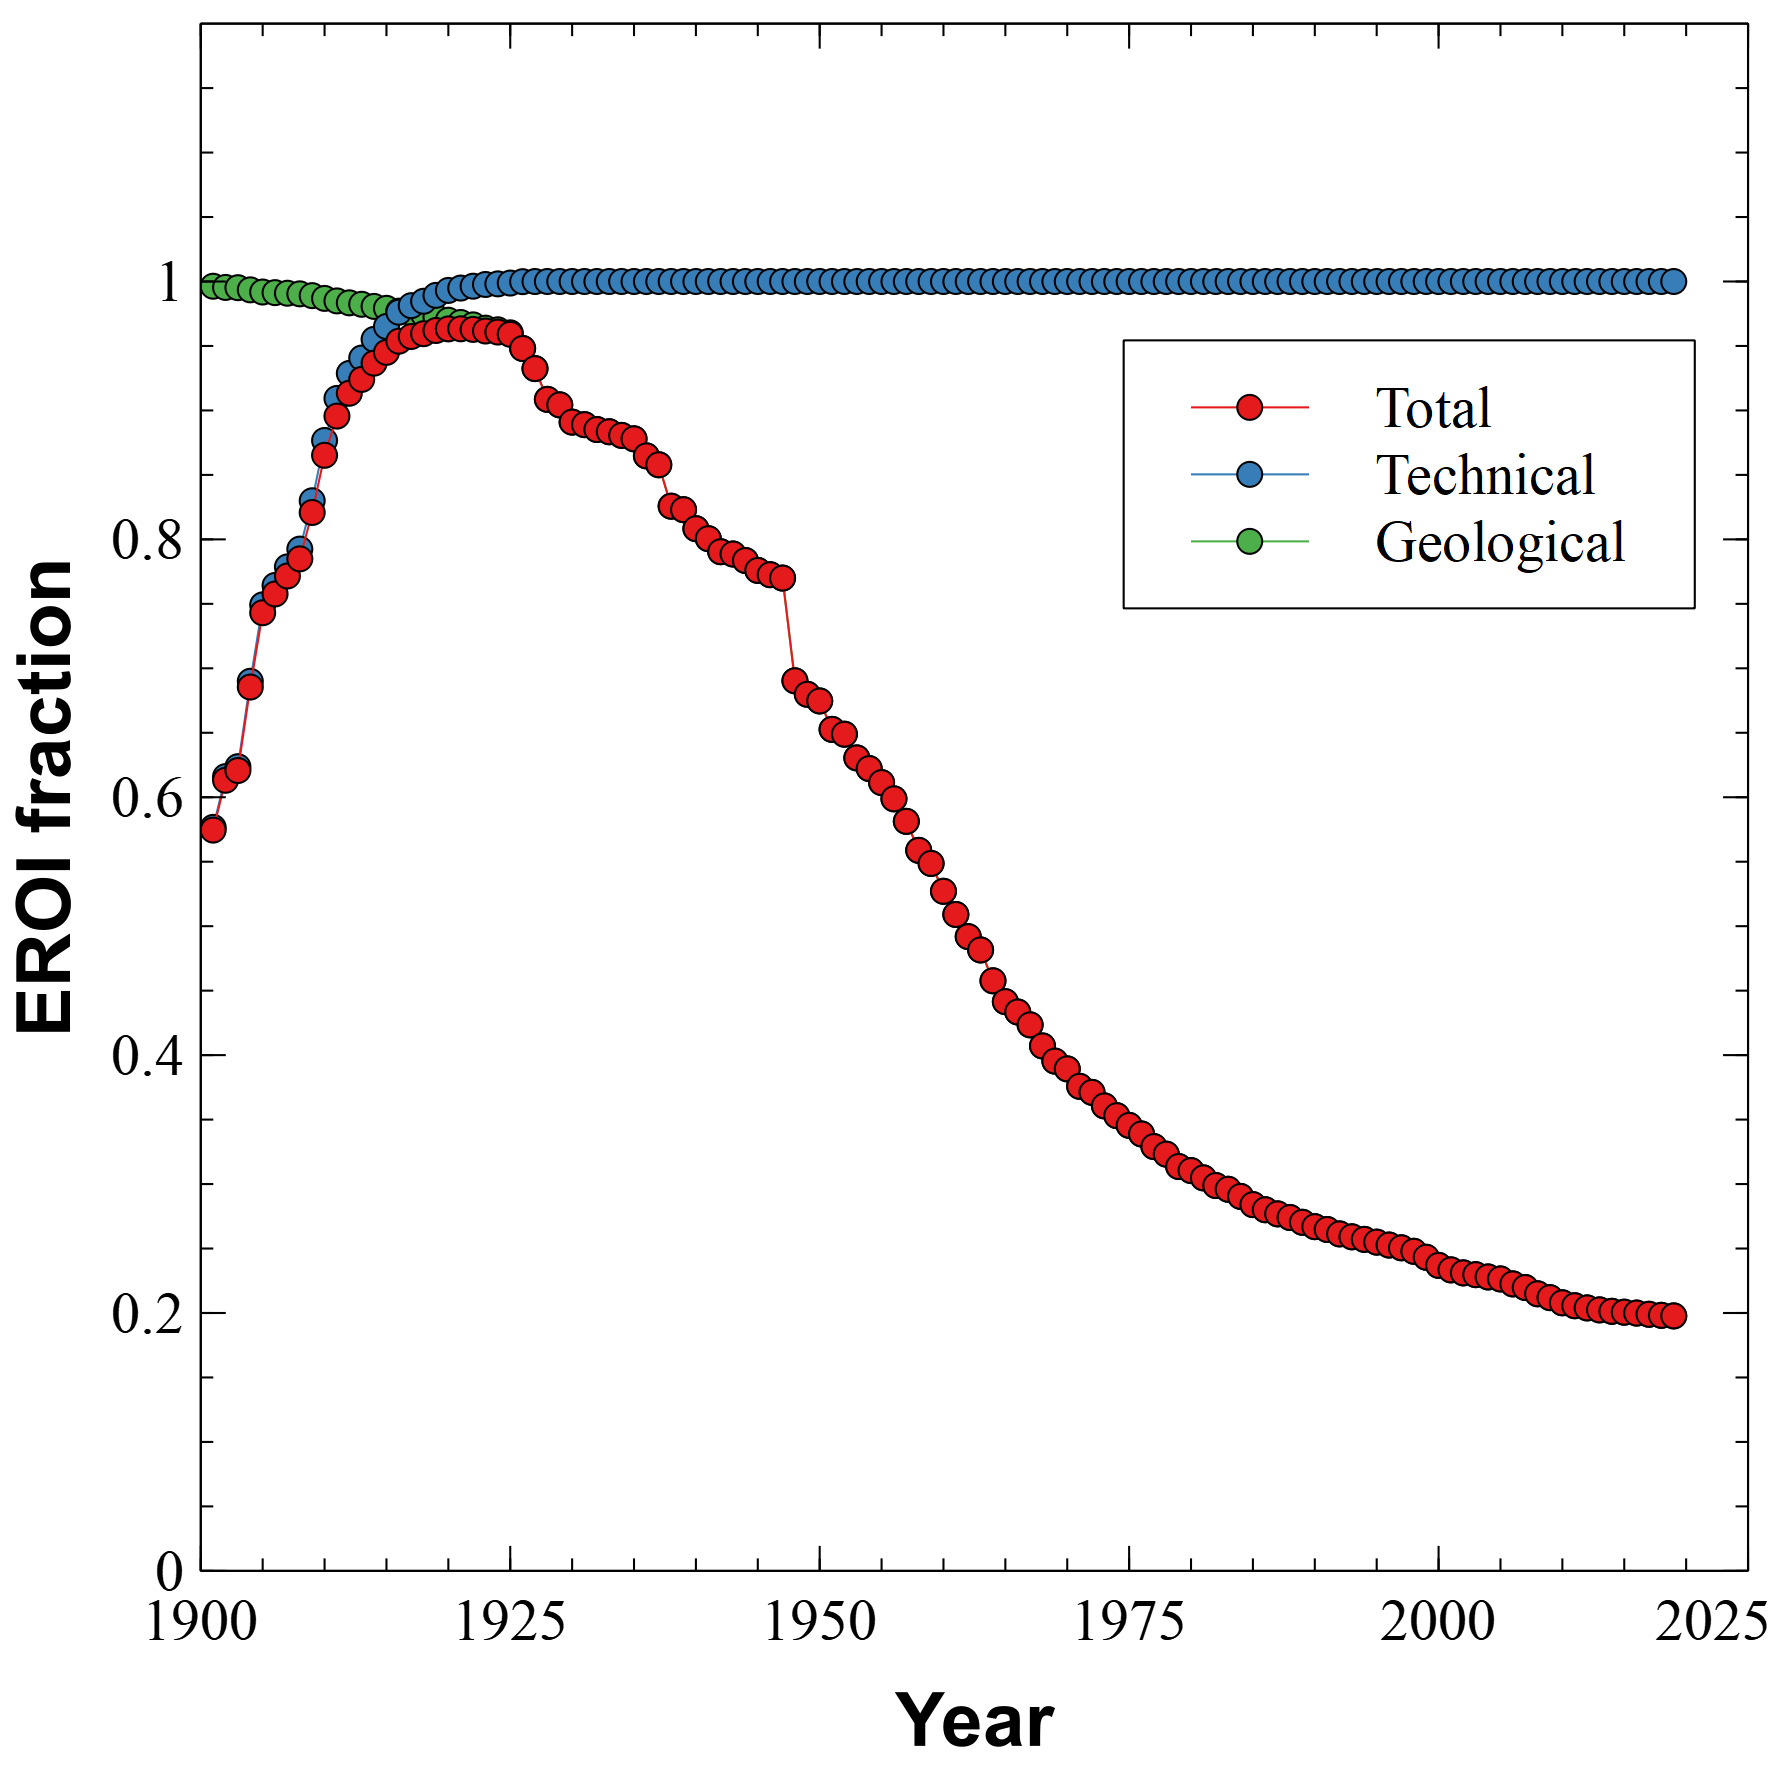
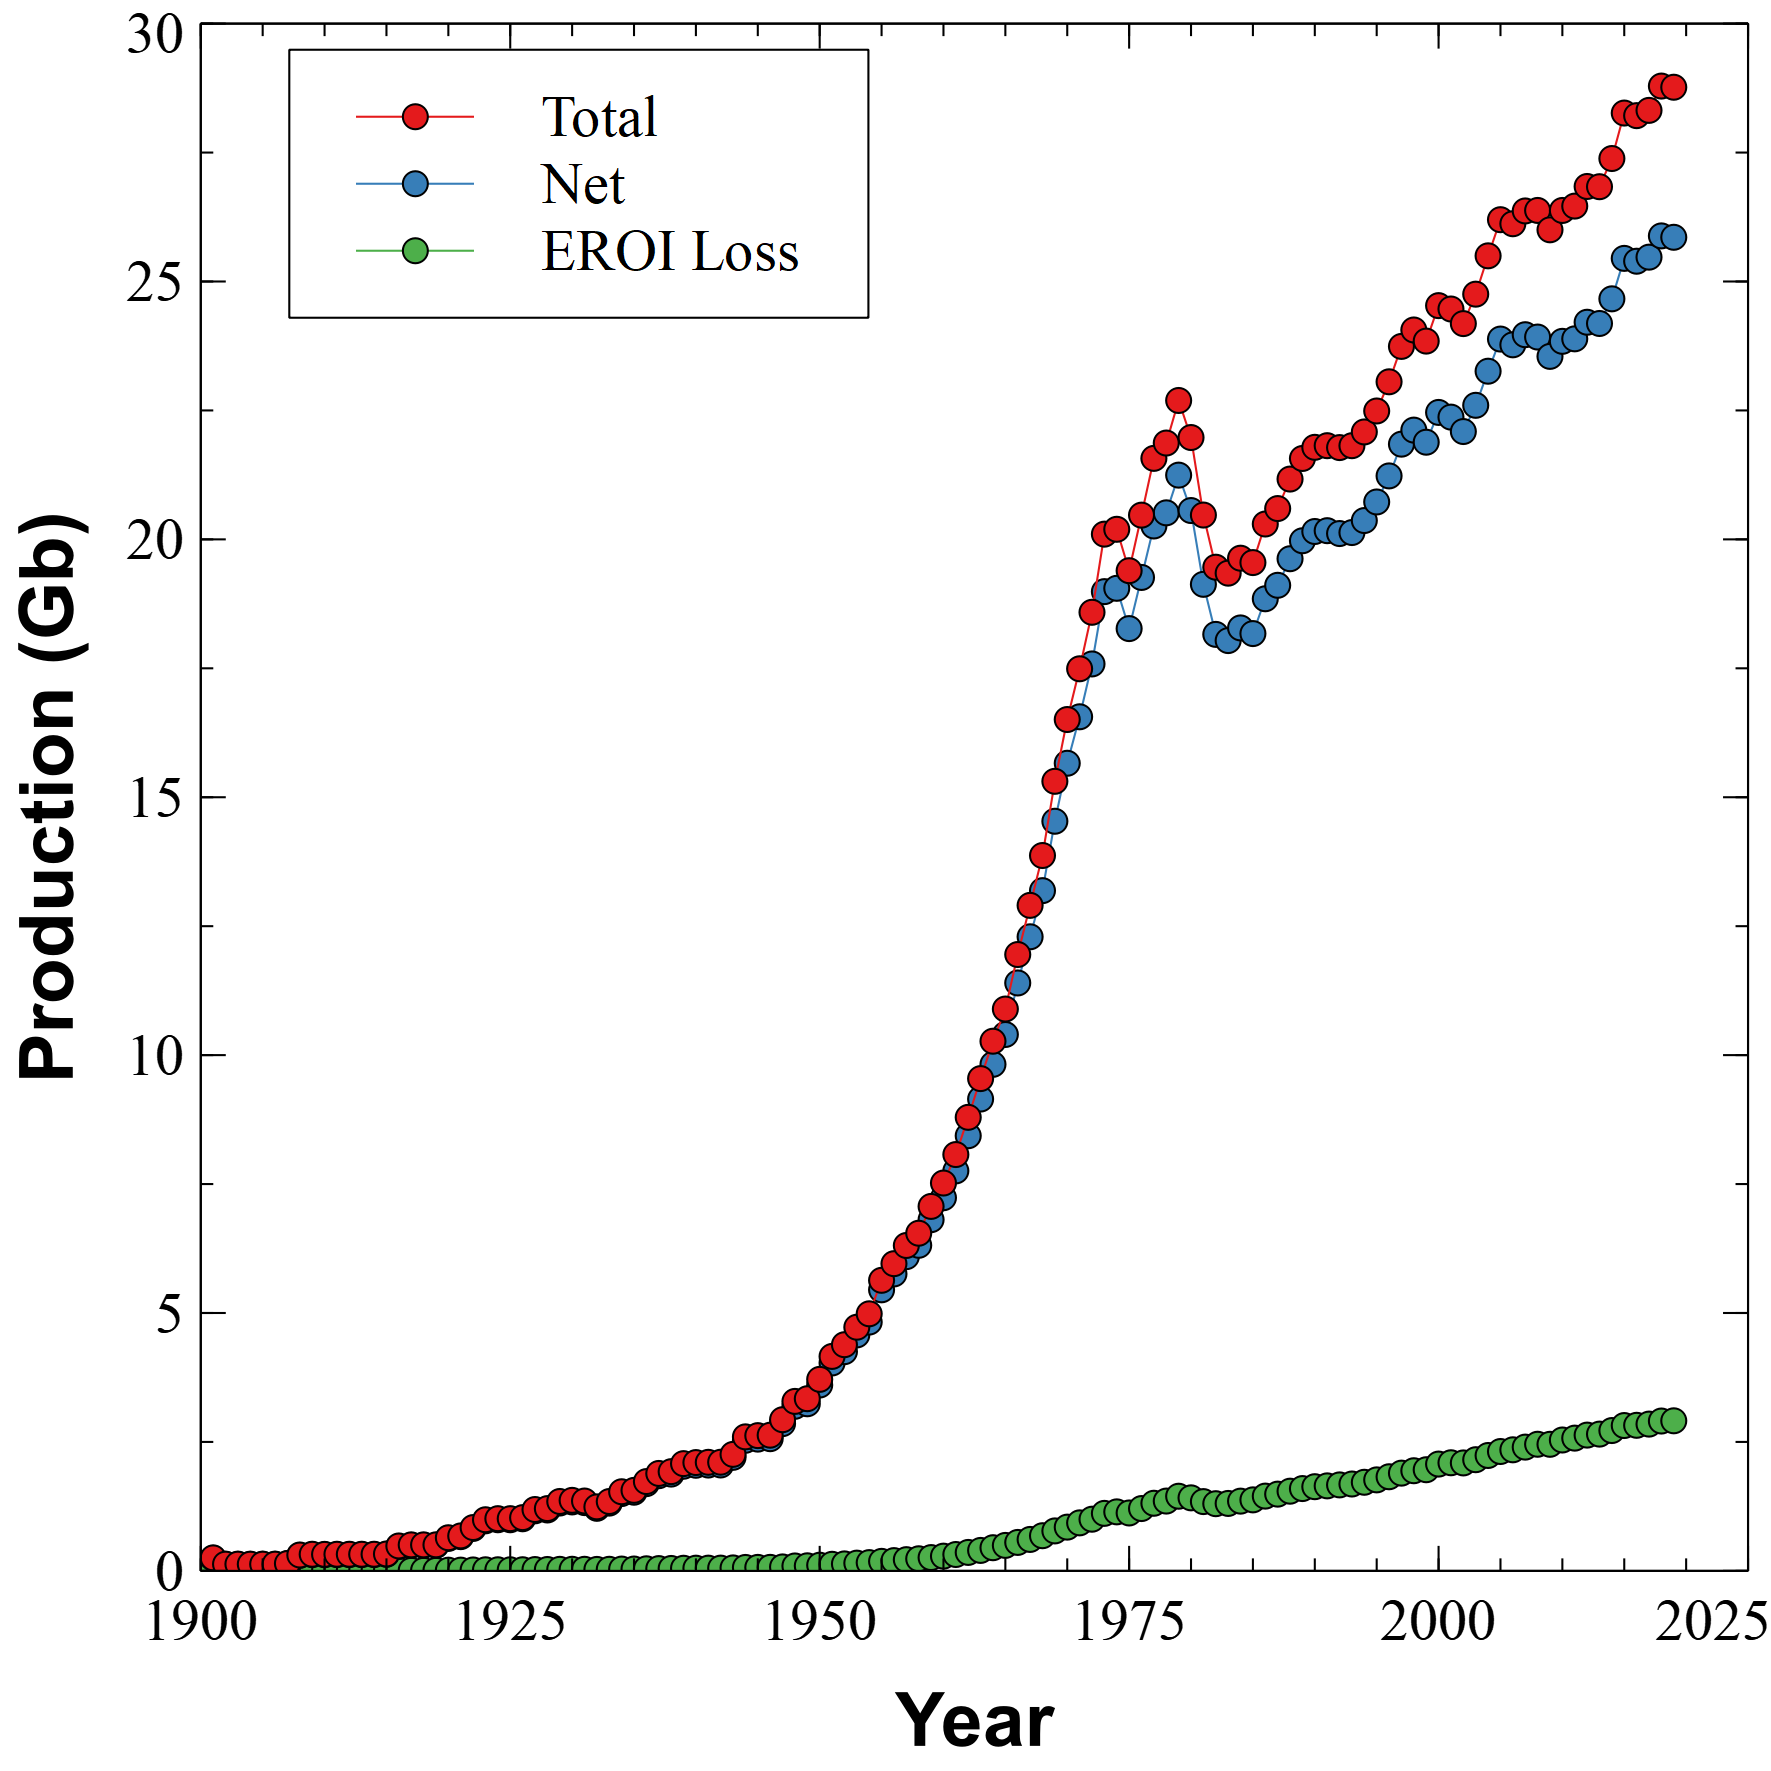
In their paper, Long-term estimates of the energy-return-on-investment (EROI) of coal, oil, and gas global productions, Victor Court and Florian Fizaine develop a function to fit their estimates of the EROI for oil. They use two components in their model - a technological component and a physical component. The technological component models how rapidly oil companies learned to find and extract oil.
The physical component is a limit based on the increasing difficulty of finding oil fields, and the decreasing size of fields. The bigger, easier to extract resources tend to be found and produced first.

The x − x- x−axis of the plots is the fraction of the available resource discovered to date, while the y − y- y−axis represents the fraction of the maximum possible EROI. Using their functions, we can plot the EROI as a function of time.
The right end shows we are now only able to get about 20% of the maximum possible EROI, which was achieved in the early 1920s. Another way to look at this is to compare the yearly production to the net available. For example, if the EROI is 50 to 1, then we have 50 barrels available after using one to extract the total.
Court and Fizaine assume that the maximum possible EROI was about 45. The green curve at the bottom represents the energy required to extract and process oil. The blue curve is the net available including the EROI loss. Annual consumption is the red curve, but over time less is becoming available for use in other processes. EROI losses are a second growing gap in our energy supply.
Fracking and Extra Heavy
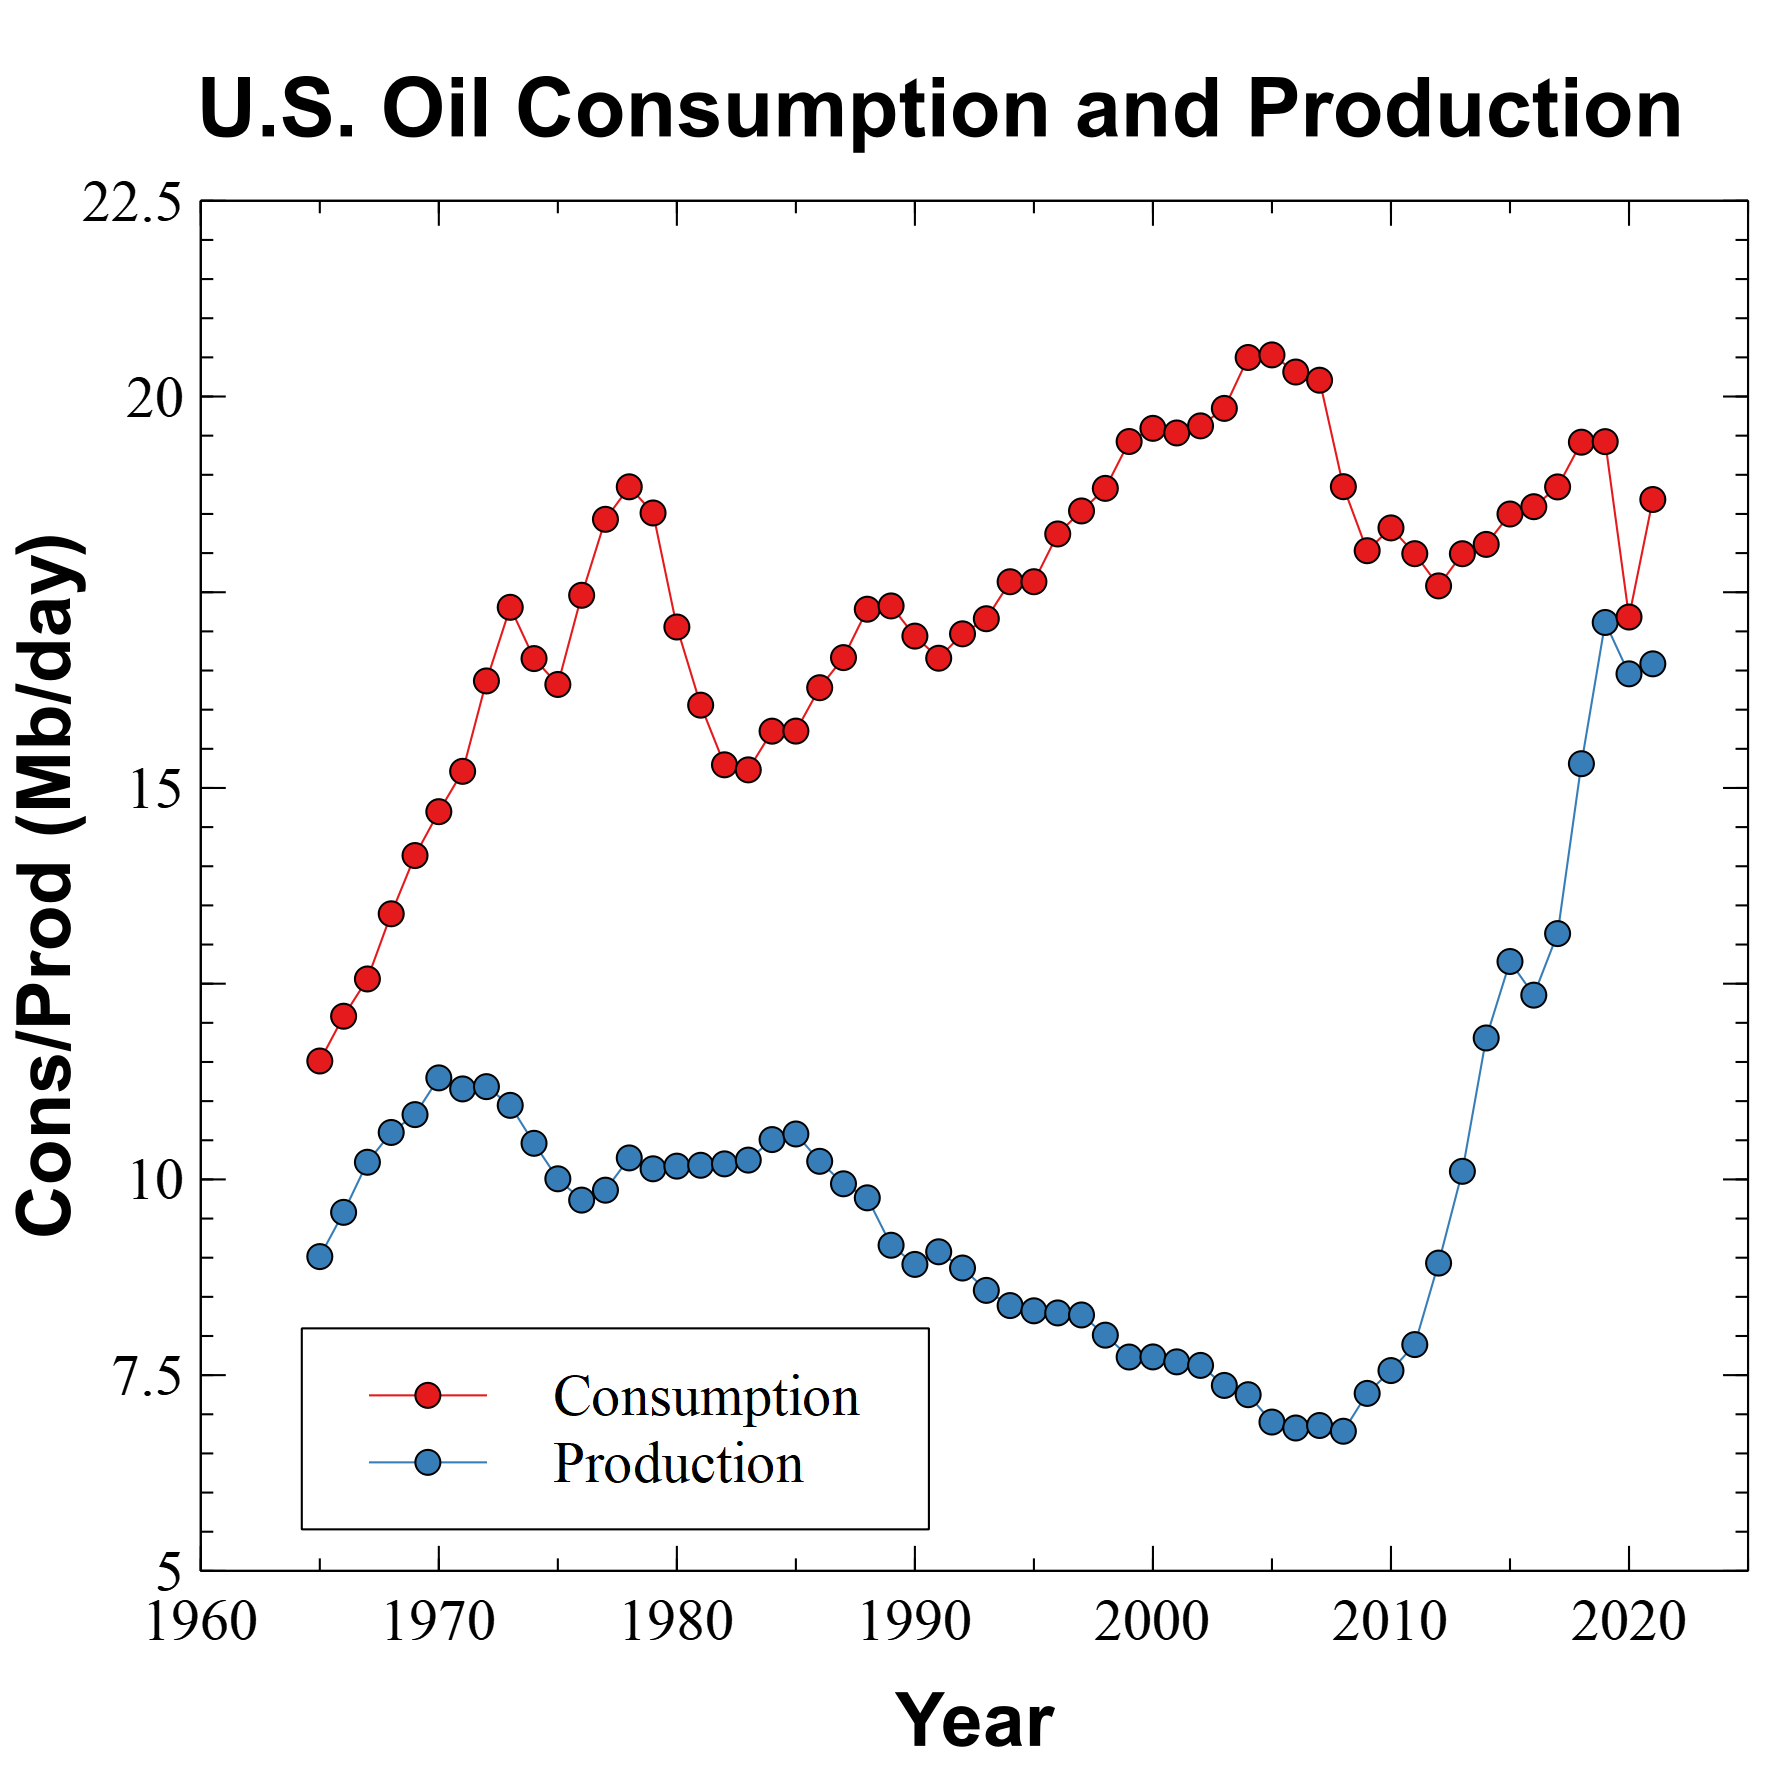
What about the fracking revolution in the U.S. over the past 15 years? Didn't that make us energy independent? Robert Rapier writes in Forbes, Surprise! The U.S. Is Still Energy Independent while Julian Lee says, Don't Believe the U.S. Energy Independence Hype in Bloomberg.
Let's look at the data rather than the dogma. This is U.S. oil production and consumption according to the BP 2022 Statistical Review of World Energy:
The rapid increase in production comes from fracking, or tight oil, which has mainly occurred in three areas, the Bakken in North Dakota, the Permian in West Texas and Eastern New Mexico, and the Eagle Ford region in South Texas. Without oil from these sources, there would be a significant oil shortfall.
There's been a lot of hype about the "fracking revolution" and how new technology enabled it to happen. This is generally untrue. Hydraulic fracturing began in the 1960s in Texas and Louisiana, and the other key component, horizontal drilling, started being used in the early 1990s. While there have been improvements in the chemical mixes used to break open oil-bearing shales, most of what enabled the "fracking revolution" was easy money.
After the 2008 economic crash, the Federal Reserve lowered interest rates and loaned trillions of dollars to large banks. Billions went into the fracking industry and operators drilled thousands of wells. The problem was that the lifespan of each well is very short, with output typically declining by 90% in the first three years, so to keep producing, the oil companies frantically drilled new wells.
The operators were very good at finding the "sweet spots" in each field, so they started in the middle and worked their way outward, but as they went the production from newer wells was less than previous wells. It became a kind of Ponzi scheme that eventually cost investors an estimated $300 billion. Investor backlash has forced oil companies to significantly scale back new drilling operations.
In 2019, David Hughes published the Shale Reality Check. In a Post Carbon article, Asher Miller says of it,
Though Hughes is careful to focus his analysis only on the geological and technological feasibility of the EIA’s forecasts, I have to stress that when viewed from the broader perspective of economic, energy, and climate security, the EIA’s Annual Energy Outlook is borderline insane.
Even if U.S. oil production almost matches consumption, an overlooked issue is that of embedded energy in the products we purchase. We import much more embedded energy than we export just by being one of the world's largest consumers of foreign products. In The myth of US energy independence, Shepard and Pratson argue
The current energy shock will have longer-lasting impacts than even the COVID-19 pandemic because it will permanently alter the composition of the global energy network rather than putting it on pause. The US is at a crossroads regarding its energy independence. On one path, it can maintain the status quo of importing goods and services without regard for the energy required to produce them. On the other path, it can strengthen its energy security by enhancing the domestic capabilities of the supply chains it depends on while supporting energy independence abroad. The latter is much more secure and economically efficient in the long run. Simply put, achieving US energy security requires all countries to achieve energy security.
Of course, this assumes that some form of domestic energy is available.
Why not include the extra heavy oils from Athabasca and Orinoco? The EROI of tar sands is very low, and without external funding, they probably won't see significant production. Looked at from an EROI perspective, though, any government or investor money is nothing more than an expectation of future energy, and that may not exist.
The projections for oil production from fracking and tar sands seems to be a reality gap.
Efficiency and Substitution
In 1865, the English economist William Stanley Jevons observed an economic paradox that now bears his name: as technological advancements improve the efficiency of energy use, overall consumption does not necessarily decrease—in fact, it often increases. Known as the Jevons Paradox, this effect occurs because efficiency gains lower costs, making energy more accessible and driving greater demand.
Jevons initially applied this idea to coal, noting that more efficient steam engines led to increased coal consumption, not less. The same principle applies to oil and modern energy sources. When industries become more energy-efficient, production costs fall, leading to higher output and expanded consumption—ultimately negating the efficiency gains at a global scale.
Some argue that energy efficiency still plays a key role in reducing fossil fuel dependence. For example, switching from gasoline-powered cars to electric vehicles (EVs) reduces direct oil consumption. However, this transition does not guarantee a net reduction in energy use. Instead of simply replacing gas-powered miles with electric miles, greater efficiency may encourage people to drive more, offsetting some of the savings. The effect is even more pronounced in industrial and commercial sectors, where efficiency improvements often lead to increased production rather than reduced energy demand.
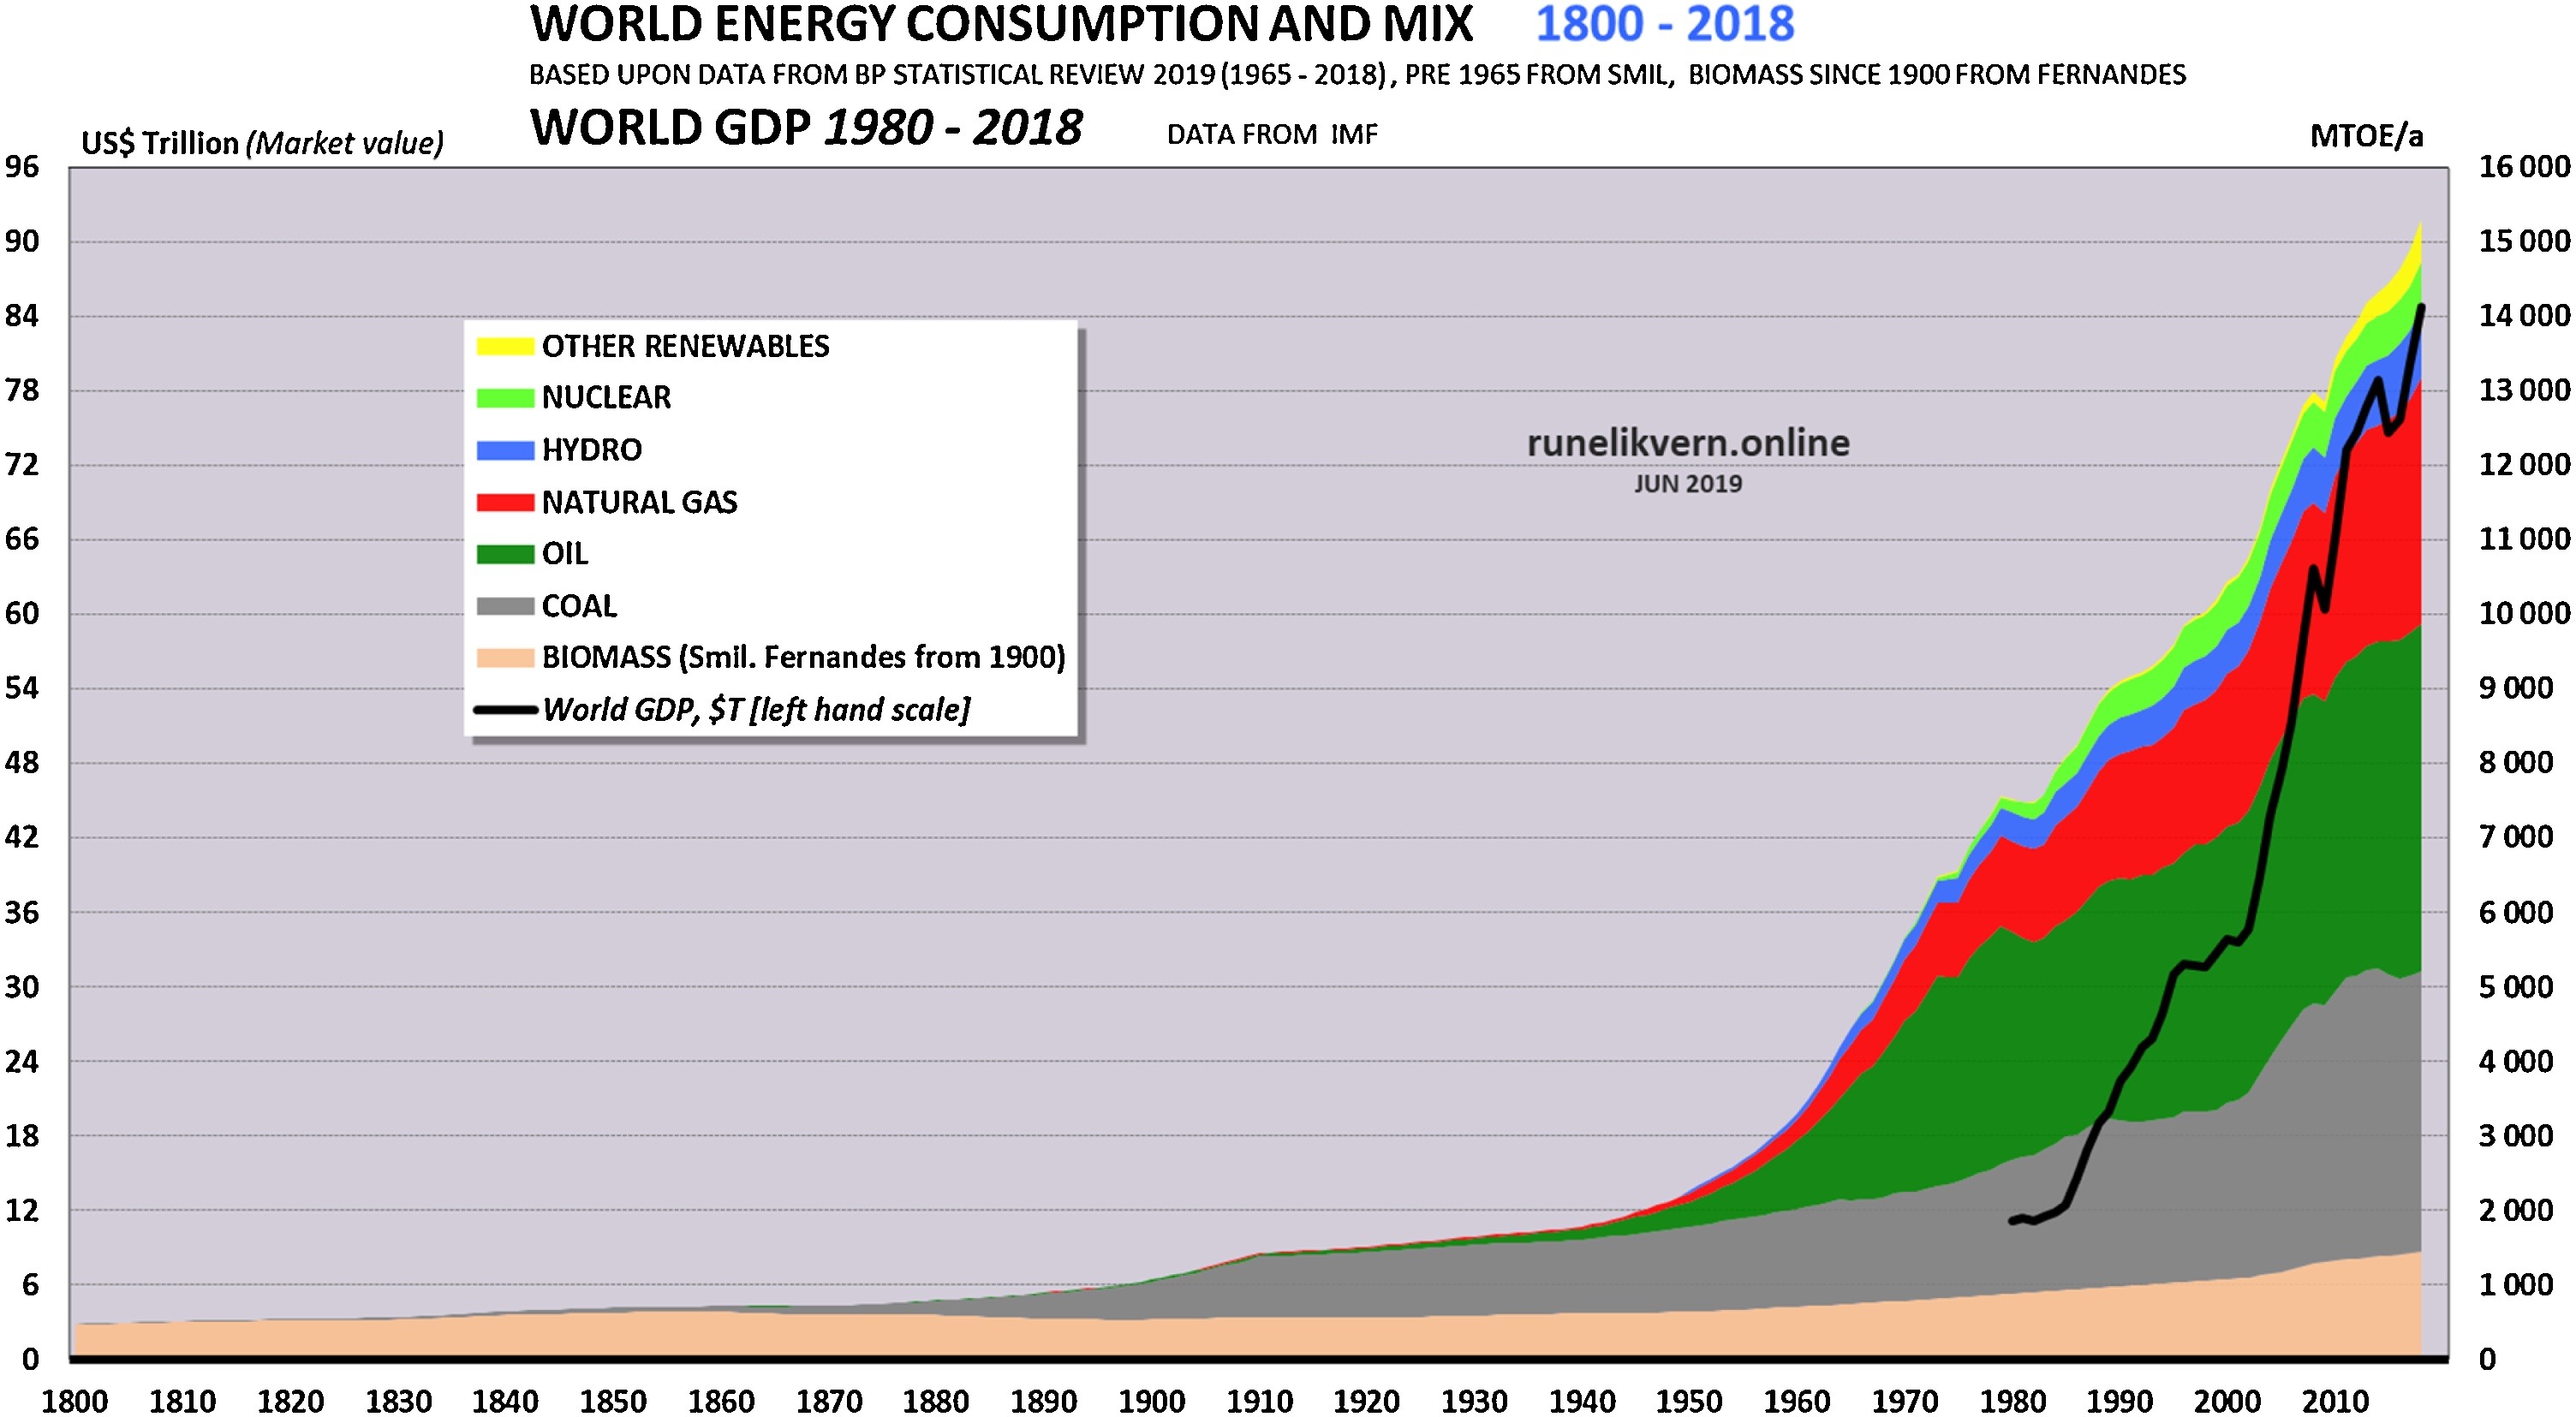
This concept extends beyond energy efficiency to resource substitution. While some believe that renewables like solar and wind will replace fossil fuels, historical trends suggest otherwise. Rather than substituting one energy source for another, societies tend to add new sources to the mix. A look at global energy consumption from 1800 to today shows that coal, oil, natural gas, and renewables have all increased in absolute terms—fossil fuel use has not declined despite major advancements in alternative energy.
This is known as the Khazzoom–Brookes Postulate, which expands on Jevons' work by stating that increased efficiency at the microeconomic level can lead to greater energy consumption at the macroeconomic level. In other words, efficiency without reducing overall energy demand does not solve the problem—it only delays the inevitable depletion of finite resources.
Efficiency without degrowth is pointless. Remember the story of the grains of rice and the chessboard? The sage asks the king for a grain of rice on the first square, two on the second, four on the third, and so on. This is an example of exponential growth.
Now think about what would happen if the king was twice as efficient with his rice. On a second chess board, he puts half a grain on the first square, one on the second, and two on the third. But, this is equivalent to the rice on the squares of the first board shifted one place over. The half grain could be placed beside the board, and then everything remains the same as in the first case.
The king is twice as efficient dispensing grains of rice, but delays the inevitable by just one day.
In economics, an annual growth rate of 3% gives a doubling time of 24 years, so you might imagine the grains of rice doubling every 24 years. The result is the same, but it takes a bit longer in real life.
This pattern is reflected in global energy consumption. We aren't substituting one form of energy for another, we're just adding more energy from all sources to the mix. Despite technological advances, total energy demand continues to rise. Efficiency gains and new energy sources have so far failed to reduce our reliance on fossil fuels—instead, they have facilitated greater expansion and consumption.
Renewable energy
Obviously, the answer is renewable energy. But, lets carefully consider solar and wind energy sources. What is meant by the terms "renewable" and "sustainable"? The energy source, the sun, will continue to provide for several billion years, but the machinery used to extract the energy has a life of only a few decades, after which it must be replaced (see The Dark Side of Solar Power).
Three bigger questions are,
- Does the technology exist to successfully transition to a renewable energy economy?
- What response from society might we expect?
- What might be the impact?
The questions could be more simply put, can we, will we, and should we use renewable energy?
Many people who consider a renewable energy future probably think that of course we can do it, and in fact, we're in the middle of a rapid transition. While it's true that new wind and solar installations are happening much more rapidly than even a few decades ago, the total energy produced is still very small relative to the energy derived from fossil fuels, and there is a large gap between total energy produced and the wind/solar component.
The questions may not have immediate answers, but there are larger issues that need to be addressed for each one.
Does the technology exist to successfully transition to a renewable energy economy?
At the moment, there doesn't appear to be the end-to-end technology required for either PV solar or wind energy to be self-sustaining, at least on an industrial scale.
Alan Turing proposed the "Imitation Game" or Turing Test for computer artificial intelligence in which a computer must be indistinguishable from a human. A similar Turing Test for renewables is needed. That is, using only the electrical energy derived from a solar panel, is it possible to make a new solar panel indistinguishable from the first? To be useful, the first panel would need to provide additional energy beyond self-replication.
The EROI of renewables may be too low to be useful. In Spain’s Photovoltaic Revolution: The Energy Return on Investment, Prieto and Hall found that the EROI was only 2.5, and panel lifetimes were under 20 years. It has been estimated that society requires an EROI of 10-15 to remain viable. At present, modern solar and wind energy systems (Siebert and Rees, Through the Eye of a Needle: An Eco-Heterodox Perspective on the Renewable Energy Transition)
are not renewable, that their production—from mining to installation—is fossil-energy-intensive, and that producing them—particularly mining their metals and discarding their waste—entails egregious social injustices and significant ecological degradation.
Many of the raw materials required for solar and wind have been extensively mined. This means that more energy is required to mine and process ore. Simon Michaux says (The Mining of Minerals and the Limits to Growth)
Current thinking is that European industrial businesses will replace a complex industrial ecosystem that took more than a century to build. This system was built with the support of the highest calorically dense source of energy the world has ever known (oil), in cheap abundant quantities, with easily available credit, and unlimited mineral resources. This task is hoped to be done at a time when there is comparatively very expensive energy, a fragile finance system saturated in debt, not enough minerals, and an unprecedented number of human populations, embedded in a deteriorating environment.
In It's Time to Wake Up Michaux says,
The currently known global mineral reserves will not be sufficient to supply enough metals to manufacture the planned non-fossil fuel industrial systems.
Alice Friedemann (When Trucks Stop Running) says,
Virtually everything in our homes, everything in our stores, got there on a truck. Prior to that, 90 percent of those items were transported on a ship and/or a train. If trucks, trains, and ships stopped running, our global economy and way of life would stop too.
Currently there are no viable alternatives to oil power for heavy trucking, ships, or long-haul aircraft.
Hubbert envisioned nuclear energy filling in for fossil fuels as reserves dwindled, and thus expected oil production to be symmetric about the peak. Without a feasible replacement energy source, this may not be true and the decline could be much steeper than the century-long increase.
What response from society might we expect?
Every indication is that society responds to new energy sources by incorporating them into the existing paradigm. There is no substitution of one source for another. Tim Garrett in Long-run global economic growth found that
... sustaining the GDP will require that we constantly grow global power production capacity; or, sustaining long-run global GDP growth will require constantly accelerating growth of global power capacity, i.e. that the rate of increase must itself increase.
yet Tom Murphy shows that physical limits to growth exist (Limits to economic growth)
In brief, inelastic demand for critical resources in limited supply will not permit prices for these things to become arbitrarily small, which would be necessary to maintain indefinite economic growth. The implications are profound in a society structured around growth, and the time limit is sooner than many assume.
Also, see our earlier post, Economics and the Stefan Boltzmann Law. At some point, exponential growth will hit hard resource limits.
What will be the impact?
Suppose we did develop some new energy source to replace fossil fuels. What impact might we expect on the biosphere?
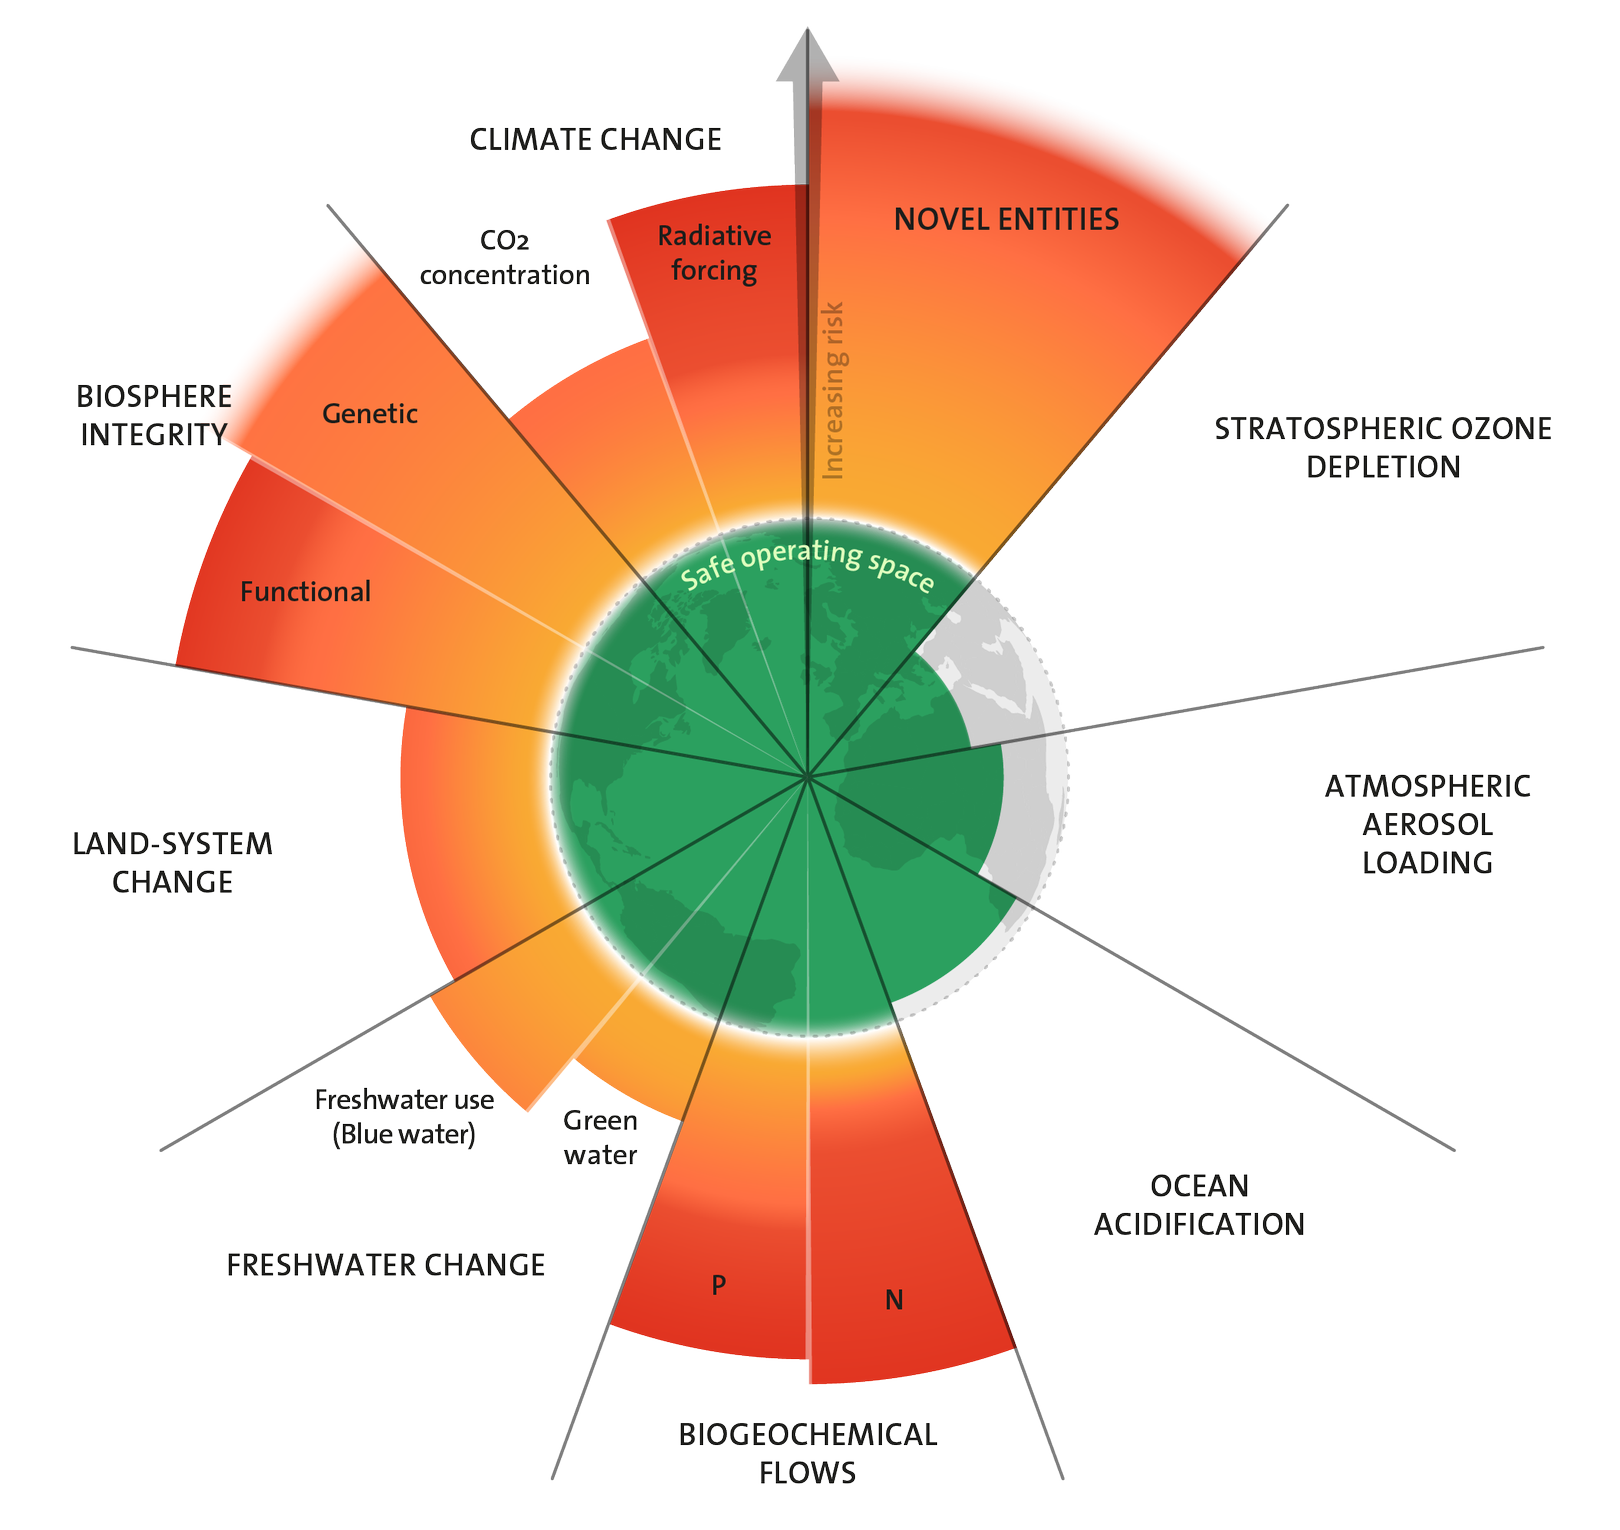
Of the nine planetary boundaries identified by Johan Rockström and Will Steffan, climate change, biogeochemical flows, land-system change, and biosphere integrity have exceeded the estimated safe operating zones.
Two boundaries, novel entities (chemical pollution, radioactive materials, AI) and atmospheric aerosol loading have not been quantified. Only stratospheric ozone depletion and freshwater use remain within the boundaries.
Most of these boundaries would continue to be exceeded even with a carbon-free energy source under business as usual conditions.
To anyone who claims that a carbon-free energy society at anything approaching the current scale is not only possible but easily achievable, a complete feasibility demonstration is urgently needed.
As Carl Sagan said, "extraordinary claims require extraordinary evidence".
Image credits
Hero: AliExpress, Creativity refuel Car Sticker
William Stanley Jevons: Wikimedia Commons
Planetary Boundaries: Stockholm Resilience Centre
Code and Software
The figure of OPEC claimed and estimated reserves was generated with Plot_OPEC_reserve.m in Octave. Data was taken from the 2006 BP Statistical Review of World Energy and is embedded in the code. More accurate data might be available from later reports.
The bar chart of discoveries overlaid with yearly production was done using the Veusz worksheet Discoveries-Production.vsz. The cumulative discoveries and production chart was generated using Veusz and saved as Cumulative-Discoveries-Production.vsz. Input data is from DiscProd.csv where discovery (Disc) and production (Prod) data came from digitizing Fig 4 of the paper using WebPlotDigitizer. The remaining columns were calculated in a spreadsheet.
Discovery data from the digitized plot was interpolated using the nearest neighbor, while the production data was cubic spline interpolated in the Octave function discProd.m. The output was written to the files discoveries.csv and production.csv. Fig 4 had been cropped to 70 Gb, so the raw data for 1948 has been adjusted to 146 Gb using BP data.
The Hubbert Linearization plots were made with Hubbert-Linearization.vsz, and by adjusting the fit ranges.
The Cumulative Oil Discoveries plot was generated with the R function fit2Data.r. The "Conventional Era" and "Fracking Era" plots use fit2Data.r but pass in logFit <- fit2Data(head(prodDF,100)) to use the period 1900 - 2000, and logFit <- fit2Data(tail(prodDF,20)) for 2000 - 2019 respectively. The function is contained in fitLogistic.r.
The linear fit to production data for the period 1980 - 2019 was done using the Veusz linear fitting (pg. 5) routine.
EROI was generated with Net-EROI.vsz using data in EROI.csv. The data is derived from DiscProd.csv using the Court and Fizaine parameters with the Octave function EROI.m. Instructions for running the function are shown in the example section.
U.S. production and consumption us-oil-production-consumption.csv was derived from the BP Statistical Review of World Energy and plotted with US-OIL-Production-Consumption.vsz.
The energy fraction chart uses global-energy-substitution.csv from Our World in Data Energy Production and Consumption using the Octave function OWD_FF_frac.m.
For convenience, all of the functions are in GrowingGap_functions.zip and the data is contained in GrowingGap_data.zip which may be downloaded from Github.
GrowingGap_functions.zip - Octave and R functions used to process data
GrowingGap_data.zip - Data for energy analysis
Peak Oil Presentation - Slides
- Octave - GNU Octave is a high-level language, primarily intended for numerical computations. It provides a convenient command line interface for solving linear and nonlinear problems numerically, and for performing other numerical experiments using a language that is mostly compatible with Matlab.
- Veusz - Veusz is a scientific plotting and graphing program with a graphical user interface, designed to produce publication-ready 2D and 3D plots. In addition it can be used as a module in Python for plotting.
- LibreOffice - LibreOffice is a powerful and free office suite, with a clean interface and feature-rich tools help you unleash your creativity and enhance your productivity.
- R and RStudio - R is a language and environment for statistical computing and graphics. RStudio is an integrated development environment (IDE) for R. It includes a console, syntax-highlighting editor that supports direct code execution, as well as tools for plotting, history, debugging and workspace management.
References and further reading
- How much oil remains for the world to produce? Comparing assessment methods, and separating fact from fiction. Laherrère, Hall, Bentley
- World oil production: past & forecasts. Laherrère
- Peak Oil. Wikipedia
- Oil Reserves. Wikipedia
- Backdating is the key. Laherrère
- Comments on Squeezing more oil from the ground by L. Maugeri. Campbell, Laherrère (Follow the links, "You can read Jean’s comments here", and Maugerifinalversion.pdf.)
- Review and Analysis of the Peak Oil Debate. Fisher
- Forecasting the limits to the availability and diversity of global conventional oil supply: Validation. Hallock, Wu, Hall, Jefferson
- Shaping the global oil peak: A review of the evidence on field sizes, reserve growth, decline rates and depletion rates. Sorrell, Speirs, Bentley, Miller, Thompson
- Fossil Fuels. Yildiz
- Peak oil, 20 years later: Failed prediction or useful insight?. Bardi
- Peak Oil: Assessment, Critique of the Current Solutions, and Proposition of Alternatives. Serkine
- Projection of world fossil fuels by country. Mohr, Wang, Ellem, Ward, Giurco
- Global Oil Market Forecasting Models. Akinfiev
- WORLD OIL RESERVES 1948 – 2001: ANNUAL STATISTICS AND ANALYSIS. Energy Exploration & Exploitation
- Hubbert math. Claerbout, Muir
- Economics for the future – Beyond the superorganism. Hagens
- No matter who wins. Hagens
- Where are we going?. Hagens
- Unraveling the Complexity of the Jevons Paradox: The Link Between Innovation, Efficiency, and Sustainability. Giampietro, Mayumi
- Resources for a better future: Jevons Paradox. Bliss
- Limits to economic growth. Murphy
- The myth of US energy independence. Shepard, Pratson
- Scientists' warning on population. Crist, Ripple, Ehrlich, Rees, Wolf
- Tilting at Windmills, Spain’s disastrous attempt to replace fossil fuels with Solar PV, Part 2. Friedemann
- Sustainable Energy — without the hot air. MacKay
- Peak Industrial Output and the Limits to Growth as a Consequence of Depleting Natural Resources The permanent divergence of the real economy and the fiat economy. Michaux
- The Mining of Minerals and the Limits to Growth. Michaux
- Oil from a Critical Raw Material Perspective. Michaux
- It's Time to Wake Up. Michaux
- Assessment of the Extra Capacity Required of Alternative Energy Electrical Power Systems to Completely Replace Fossil Fuels. Michaux
- Peak lithium makes transportation & electricity storage pointless. Friedemann
- Why Canadian oilsands will not help solve the energy crisis. Friedemann
- When Trucks Stop Running. Friedemann
- Transportation: How long can we adapt before we fall off the Net Energy Cliff?. Friedemann
- Spain's Solar Revolution Revisited (Six Years Later). Prieto
- Through the Eye of a Needle: An Eco-Heterodox Perspective on the Renewable Energy Transition. Seibert, Rees
- COP-26: Stopping Climate Change and Other Illusions. Rees
Blogs and Websites
- Institute for the Study of Energy & Our Future
- Energy Skeptic
- The Collapse Chronicle
- Problems, Predicaments, and Technology
- Desdemona Despair
- resilience
- Resource Insights
- Radio Ecoshock
- LifeItself
- Peak Oil Barrel
- The Easiest Person to Fool
- Surplus Energy Economics
- post carbon institute
- Consciousness of Sheep
- Mongabay
- …and Then There's Physics
- Crude Oil Peak
- Our Finite World
- The Energy Bulletin
- Shale Bubble
- The Great Change
- Damn the Matrix
- Wrong Kind of Green
- The decline of oil has already begun
- Museletter
- Net Zero and Carbon Neutrality: Unscientific Myths for an US and THEM World - Club of Rome
- Club of Rome
- un-denial
- Of Two Minds
- Oily Stuff
- Doomsday Now
- Marshall Brain
📬 Subscribe and stay in the loop. · Email · GitHub · Forum · Facebook
© 2020 – 2025 Jan De Wilde & John Peach